
In the world of industrial automation and manufacturing, we often get caught up with conversations around an entire enterprise when it comes to data. With the popularization of topics such as UNS, Industry 4.0, IIoT, it’s not surprising that all many care about is scale and projects that span across multiple facilities.
What I’ve personally noticed is that if you neglect local, or machine data, none of the above becomes possible. Operators aren’t going to be sold on the idea of funneling data into dashboards and being presented with insights if they can’t understand why the machine they’re standing in front of is at a standstill. They simply don’t care about the previous quarter as much as they do about getting the machine back up and running with what they have in front of them.
For that reason, I’d like to focus the conversation for this post around machine / local data. To set this stage, local data can be defined as mostly “raw” data coming from field devices with minor changes made at the PLC / IPC layer. Although it’s possible to send data back from the upstream layers (Ex: SCADA, MES, ERP), for the purposes of this post, we’re going to talk about the data needed at the PLC / HMI layer without the use of any other layers whatsoever.

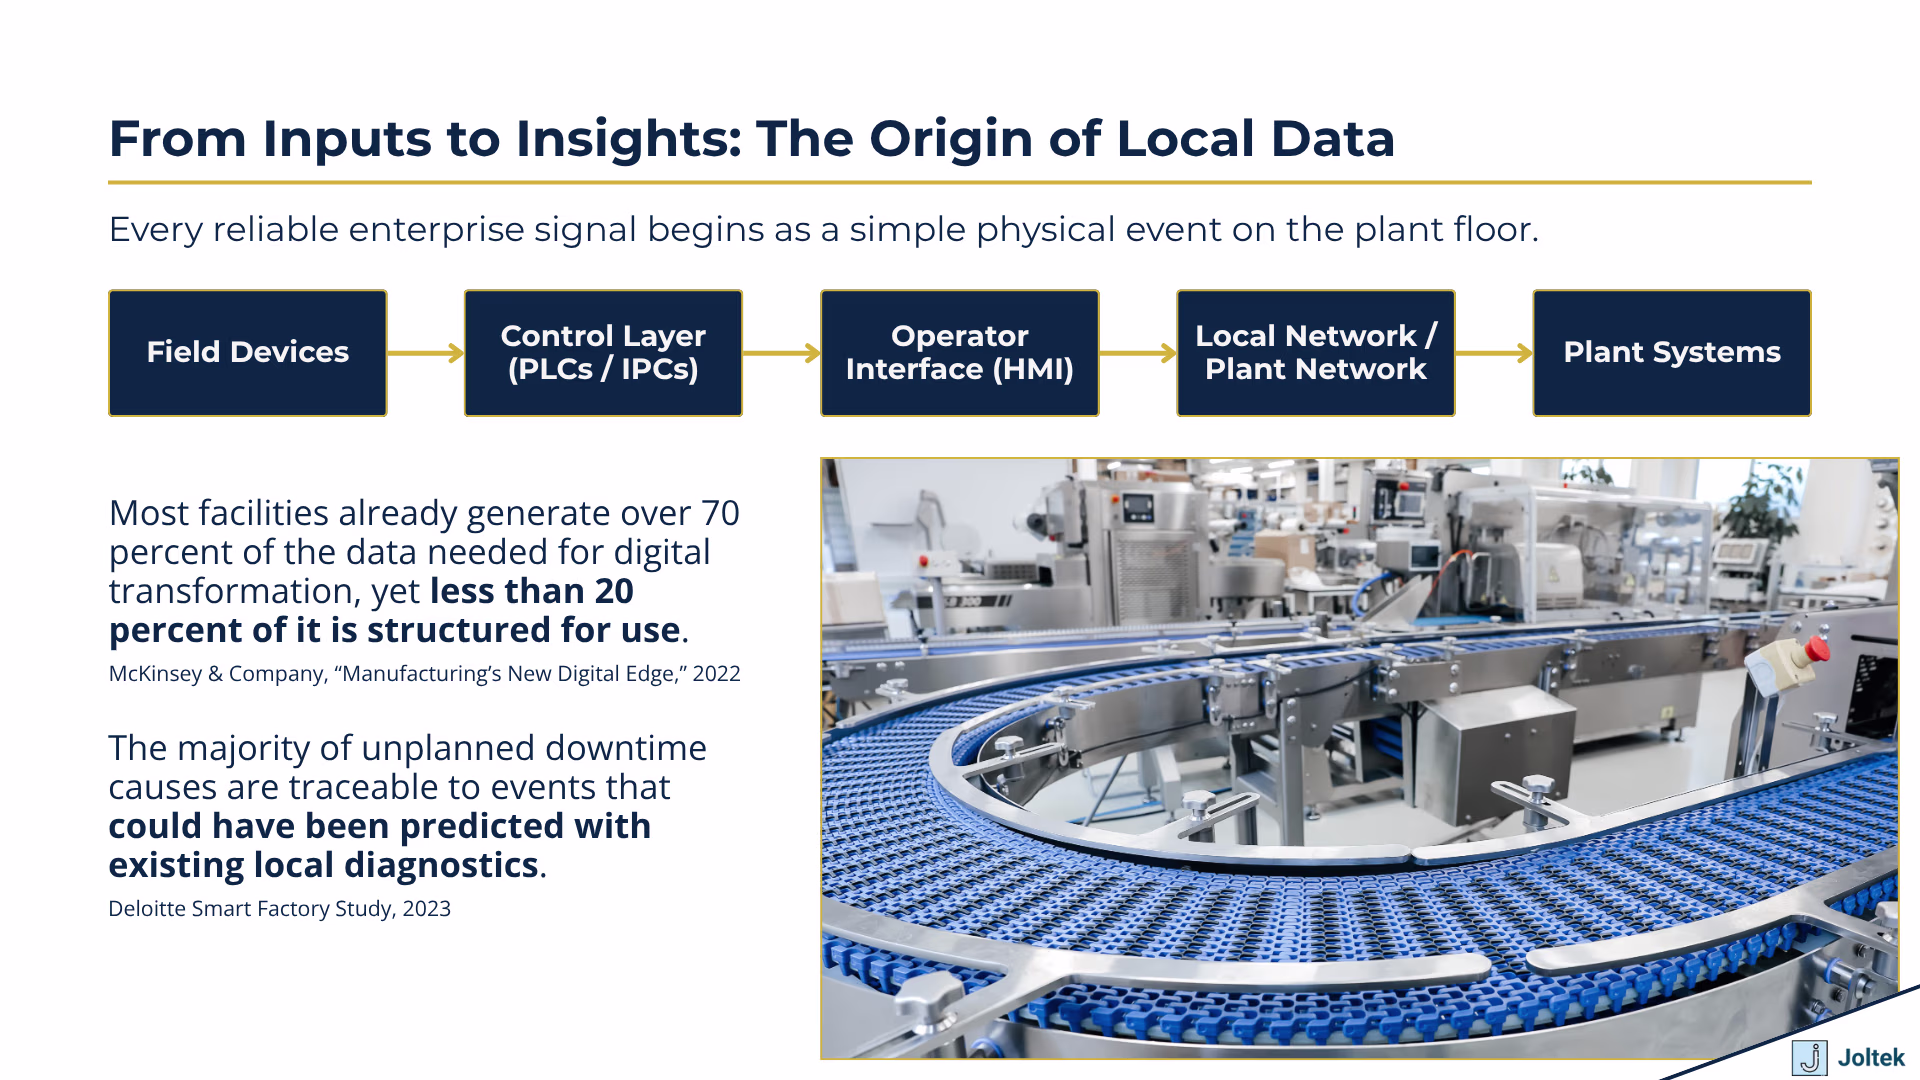
Every machine, process, packaging, or otherwise is made from various inputs and outputs. All the field devices will send or receive digital / analog signals directly via PLC modules, or indirectly through hubs, drives, etc. This is somewhat of an oversimplification as you’ve got multiple protocols, different hardware, and some other means of getting this done. However, to keep things simple let’s assume that there are inputs that generate data and outputs that consume data.
The most basic example of data would be a push button which when energized sends a HIGH signal to the PLC which can then start a motor. A second pushbutton is used to send a signal and stop the same motor. In this instance, we have two push buttons and an output to a contactor which is tied to a three phase motor. We also have a PLC which stores the registers associated with the inputs and outputs.
The real world is rarely as simple, so let’s paint a broader picture. In general, the pushbuttons aren’t going to be physical, but presented to the user via a local HMI. Now, we’ve got signals between the PLC and HMI. Similarly, it’s much more frequent to see a VFD being used for a motor over a contactor (They’re not exactly the same cost, but negligible enough for most applications), which means that we’ve now got 3 devices on the network. Let’s not forget that at this point we need a switch to facilitate communication between the devices, and we probably need some sort of safety mechanism (Ex: E-Stops).
As you can see, it’s not difficult to picture a rather simple application to dictate less than simplistic solutions on the automation side.
So where does data come into the picture?
Well, now that we’ve got all these devices, we can start adding various layers of information that may or may not be relevant for this specific application. First of all, we have the general states of the hardware: ON / OFF, LOW / HIGH, Running / Stopped, etc. These components are critical to “run” the system as it is intended. Additional data can be “created” and “accessed” for configuration purposes. For example, I may want to change the parameters of the VFD - all of that data is usually stored in the registers and allows the end-user to set specific motor information, but also process variables (Ex: speed, acceleration, limits, etc.). Next, we have system configurable data which is process specific. For example, the user may want to start the motor for 5 minutes after the press of the button, or they might want to start it until it is stopped. Lastly, we have data associated with the state of the system. For example, the user may want to confirm that the motor is actually running by using a high speed counter, or by reading the registers of the VFD. The user may want to collect information about the time the system has had the motor on to perform maintenance. Similarly, the team probably wants to display a tangible alarm based on the state of the VFD. For example, Error 73 for a PowerFlex525 system may mean “overtorque” which is going to give the operations team a starting point as opposed to scrambling to find the manual.
The relatively simple application can very quickly spiral out of control.
With all of the above in mind, it’s easy to go overboard. The biggest question in our industry - which data is relevant for my facility? is probably never getting a tangible answer… It depends.
Let’s start by classifying different types of data and prioritizing based on the type.
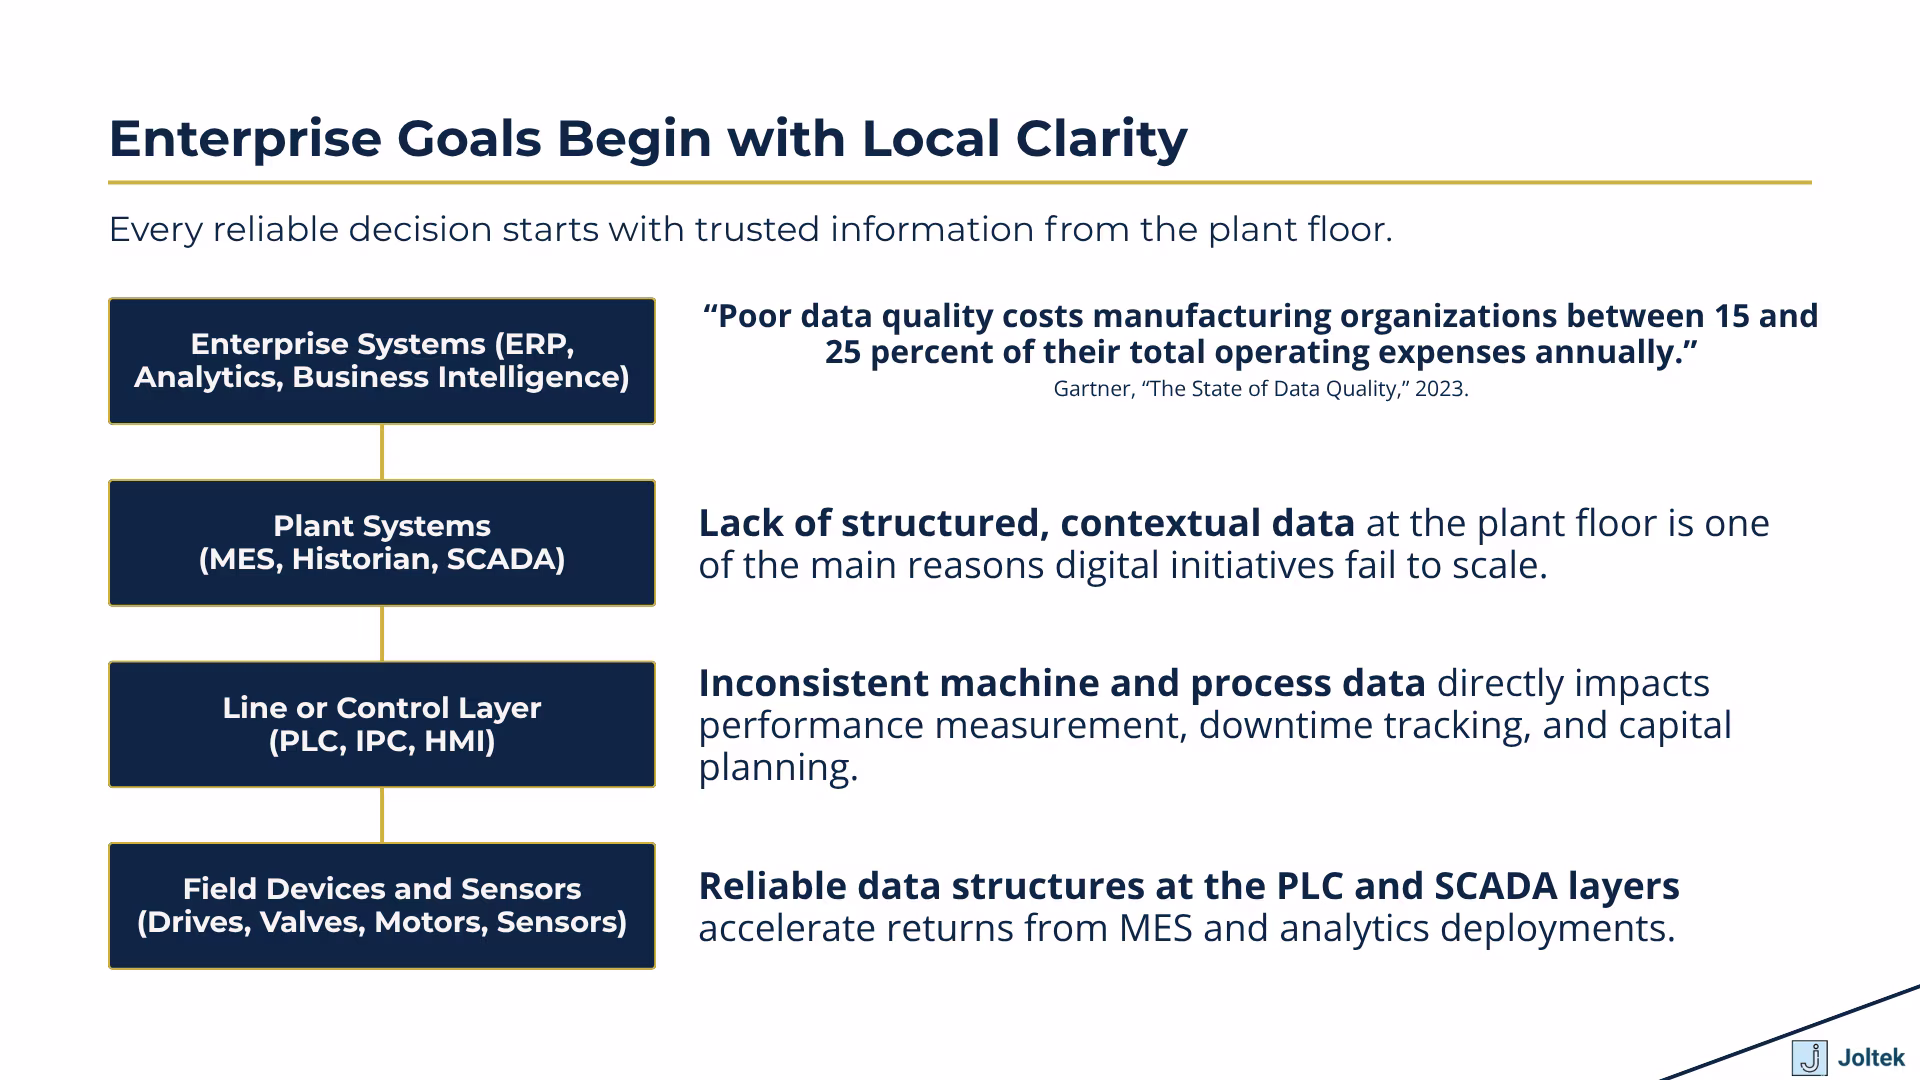
When it comes to control system design principles, the answer is clear - if we have field devices tied to our system, we must ensure that the data coming in or out is of highest priority. In other words, the raw data coming from sensors, or the raw data going out to output devices needs to be collected, processed, and sent out first. Without this data, the system simply can’t operate.
Type 1 data needs to be protected at all cost which generally means that the “mission critical” routines within a PLC will almost always take precedence over any other “activities.”
Type 1 data is generally used in “high-speed” logic and leads to the execution of the core process.
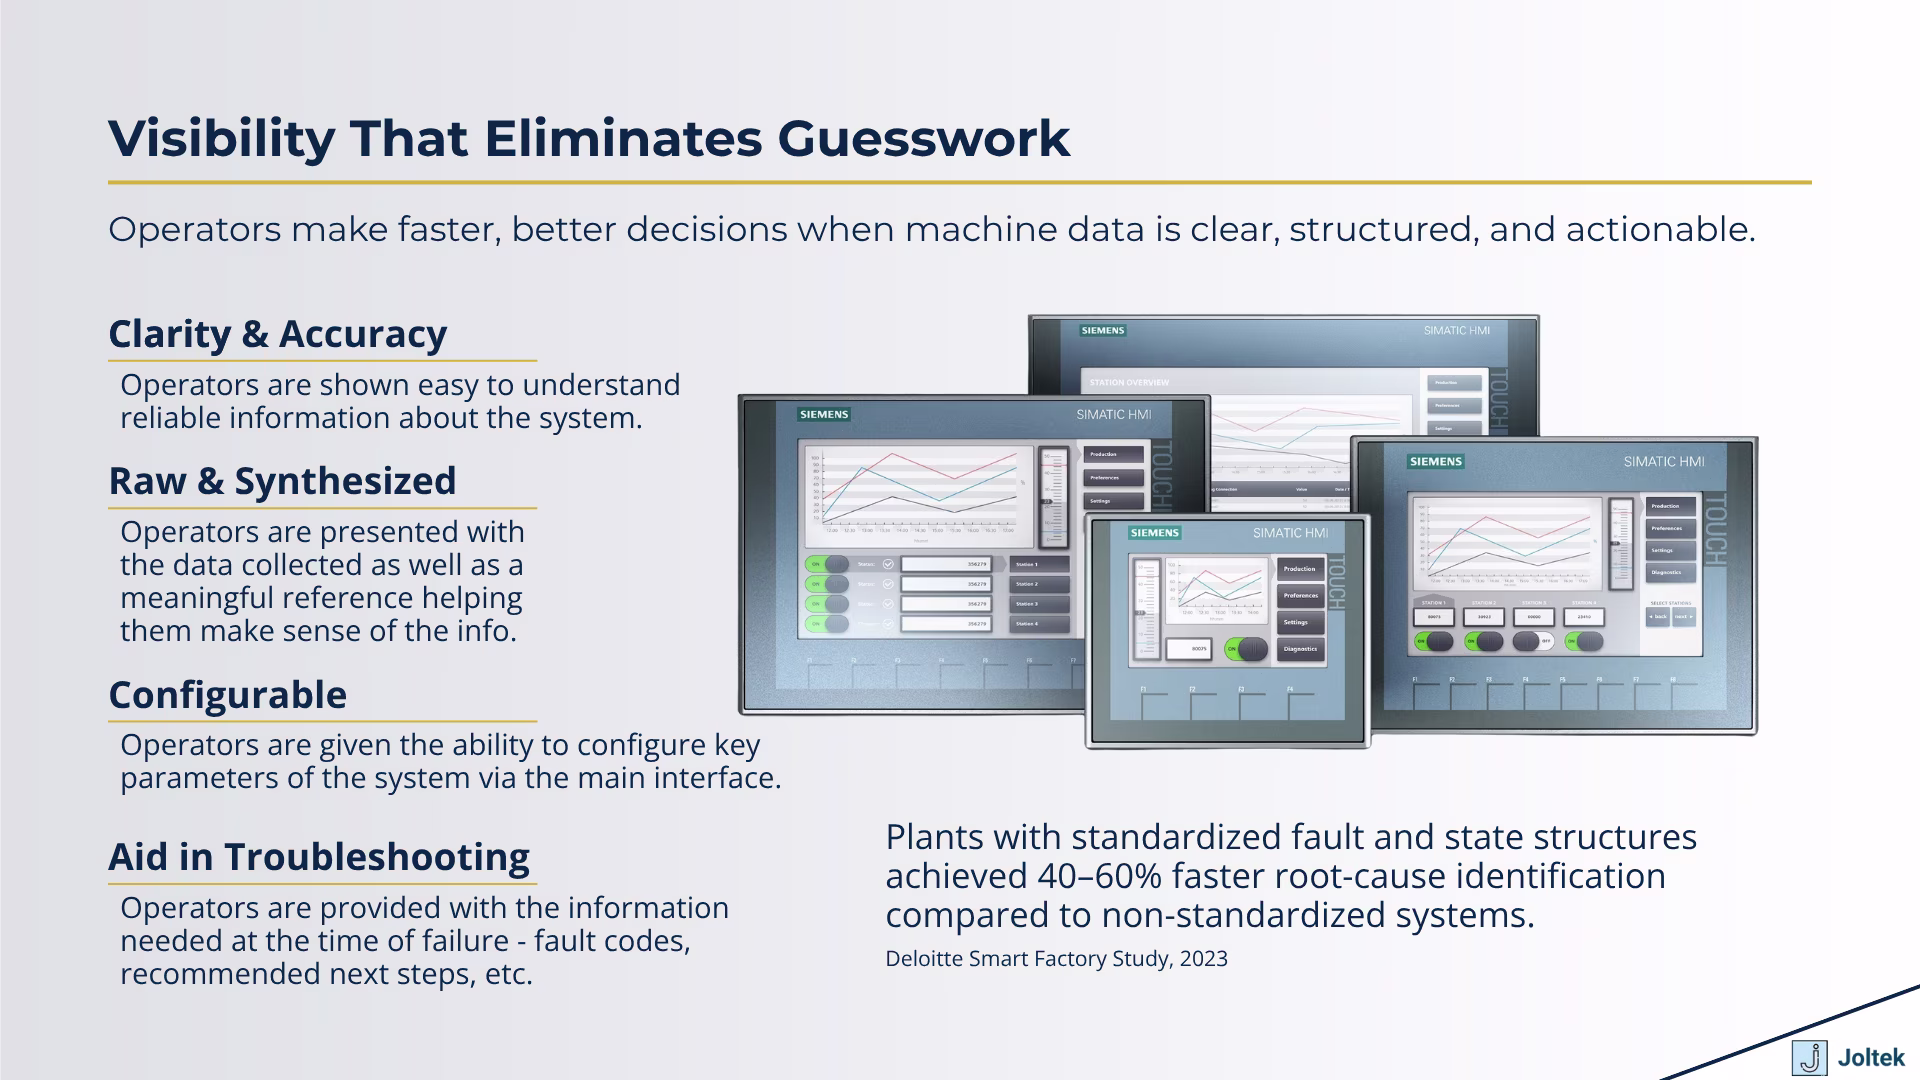
Once the control logic performs its basic purpose of turning inputs into outputs, the next layer of information concerns how the system behaves. This is what we call state data. It does not drive the process directly but tells us whether the process is healthy, safe, or even functioning as intended. State data is what allows engineers and operators to move beyond “Is it running?” to “Why did it stop?” and “What exactly is happening right now?” It is a layer of awareness that transforms a purely reactive control system into a diagnosable and optimizable environment.
At this level, the control system starts to describe itself. It reports on modes of operation, system availability, and alarms. For example:
Each of these states is captured as discrete signals within the PLC and may be displayed on the HMI. In modern systems, this information can also be stored for historical analysis. The moment this data becomes available, operators gain visibility into the true condition of the process rather than only its result.
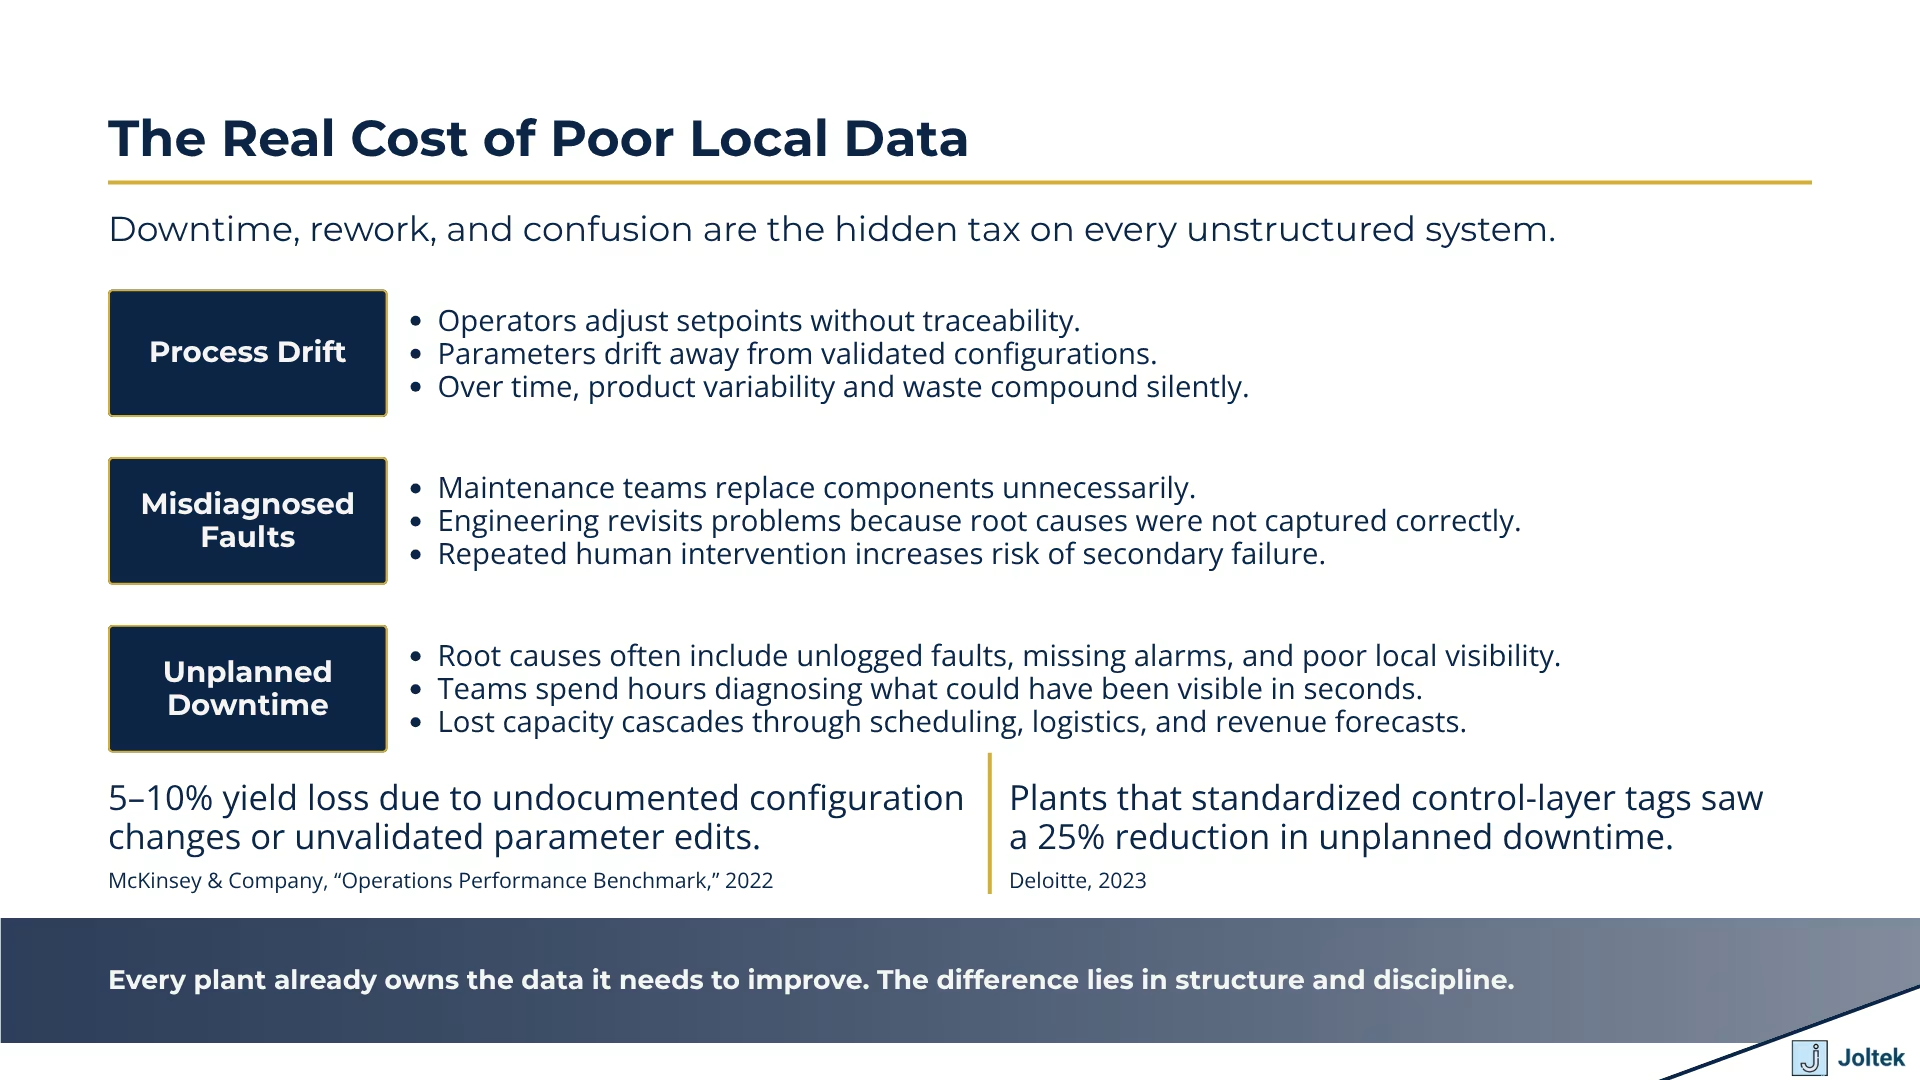
Industry research continues to show that the average cost of unplanned downtime exceeds two hundred sixty thousand dollars per hour. While that number is dramatic, it illustrates a truth that every plant manager knows: it is not the major project delays that hurt most, but the accumulation of small, unexplained stoppages.
When a motor fails to start and the operator cannot tell whether the fault is mechanical, electrical, or network related, valuable minutes are lost. A clear state structure in the PLC and HMI eliminates this guesswork.
This is why during Joltek’s Plant Systems Health Assessments we focus heavily on how fault and state information is represented at the control layer. Poorly designed state logic is one of the most common root causes of recurring downtime, yet it rarely appears in executive dashboards because it is a local problem.
Many systems in operation today were designed without a consistent method for communicating state. Each OEM or integrator implemented its own naming, structure, and logic conventions. As a result:
The result is tribal knowledge instead of structured intelligence. This situation makes scalability nearly impossible. You cannot standardize analytics when even the definition of “Running” differs across assets.
Establishing a consistent way of representing system states does not require a new technology stack. It requires discipline in design. A few key principles help:
Once these basics are in place, the plant begins to generate consistent, actionable information from the ground up.
As discussed in the previous sections, once the control system is capable of receiving and sending reliable signals, the next layer concerns how the process behaves within its designed limits. Configuration data defines how a machine or system should perform under specific conditions. It represents the rules and settings that shape the process but do not necessarily change from cycle to cycle.
Almost every industrial process relies on some level of configuration. These are the parameters that make a machine flexible enough to handle variation while still preserving control and repeatability. For example, a packaging line may need to adjust the speed of a conveyor, the acceleration and deceleration of a motor, or the fill level of a product tank. These parameters do not change on every start, but they are crucial when shifting between products, formats, or recipes.
Configuration data sits between static design and dynamic operation. It defines limits, targets, and recipes. Unlike real-time inputs and outputs, this data often lives in memory locations within the PLC or on the HMI that are accessed only when necessary.
In its simplest form, configuration may include motor acceleration rates, PID loop gains, or sensor thresholds. In more advanced processes, such as batching, mixing, or thermal control, the configuration layer becomes a full-fledged logic engine that determines setpoints based on recipes, SKUs, or production modes. This is where local data begins to blur the line between automation and information technology. The control system must not only execute instructions but also interpret data structures that define the “what” and “how” of production.
Configuration data represents the heart of flexibility. Manufacturers increasingly face smaller batch sizes, faster changeovers, and product customization. The ability to load a set of parameters that instantly adapts the machine to a new SKU or process condition is what enables modern operations to stay competitive.
This is why so many manufacturers are investing in recipe management at the control layer. When configuration data is structured well, it can be synchronized with higher systems such as MES, ERP, or quality management software. The plant floor becomes capable of receiving validated recipes electronically, rather than relying on manual adjustments by operators or technicians.
Unfortunately, many facilities remain far from this level of maturity. Configuration data is often scattered across operator screens, local CSV files, or hard-coded constants buried in ladder logic. Without standardization, every change becomes a risk. Each adjustment requires deep technical knowledge, increasing reliance on a few key individuals rather than empowering the operations team as a whole.
Because configuration data defines how the system runs, it must be treated with caution. It is not uncommon to find an HMI page labeled “Advanced Settings” behind a password gate. In better implementations, access is restricted by user role so that only maintenance or engineering can modify parameters. In weaker designs, access may be uncontrolled, leading to inadvertent changes that destabilize the process.
In highly regulated industries such as pharmaceuticals or medical devices, configuration management is subject to strict validation and audit requirements. Changes must be logged, versioned, and approved. Even in less regulated environments, establishing a clear change control policy for configuration data is a hallmark of operational discipline.
A well-structured configuration layer supports both flexibility and governance. It allows necessary changes while maintaining traceability and protecting the system from human error.

Over the years, I have seen many systems where operators were not given any permission to make adjustments. In some cases, this was due to poor design. In others, it was the result of management’s fear that someone might “break” the process. The unintended consequence is that people develop workarounds. They bypass safety interlocks, modify PLC code directly, or use unapproved files to tweak parameters.
This environment creates risk at multiple levels. It undermines safety, introduces inconsistency, and makes troubleshooting far more complex. When configuration data is not well defined or controlled, every shift becomes a new experiment. The system drifts away from its validated state, and performance metrics such as yield or quality begin to fluctuate without clear explanation.
In contrast, strong configuration practices build confidence. Engineers can implement changes safely, operators understand what is adjustable and what is not, and leadership can trace every modification back to its source.
The goal is not to eliminate flexibility but to structure it. A robust configuration strategy should include:
When configuration data is standardized, plants achieve the best of both worlds: consistent operation with the ability to adapt quickly to new requirements. It also lays the groundwork for digital transformation initiatives by ensuring that the foundational data used for analysis and optimization is both accurate and contextual.
When most people talk about predictive maintenance, their minds immediately jump to machine learning models, cloud analytics, and sophisticated dashboards. But before any of that is possible, reliability begins with something much simpler: local diagnostic data.
This is the layer that tells you not what the machine is doing, but how healthy it is while doing it.
Early in my career, I remember standing next to a packaging line that would trip almost daily. Every time it stopped, production called maintenance, and we would spend hours going through the same routine. We would check sensors, replace contactors, reset drives, and eventually get it running again. What we never did was look at the diagnostic information that the system was already generating. The PowerFlex drives had torque, current, and bus voltage data available in the registers, but none of it was being read, displayed, or logged.
Once we pulled those values into the HMI and plotted them locally, the issue became obvious. The motor was drawing progressively higher current during startup, which told us that the mechanical load was binding. What used to take hours to identify suddenly took minutes.
That moment completely changed how I think about diagnostics.
Local diagnostics are not complex algorithms. They are the direct feedback signals that a machine provides about its own condition. Torque, temperature, vibration, current, pressure, and even network quality can all serve as early indicators of trouble. Every drive, motor, and controller today has the ability to expose this information, but in most plants, it goes completely unused.
A drive might be capable of reporting motor overload, phase imbalance, or line voltage deviation, yet none of that reaches the operator’s screen. A PLC might detect increasing scan time or packet loss on a network, but no one ever sees it. The result is that teams continue to operate in a reactive mode, even though the equipment has been warning them for days or weeks.
The most powerful form of predictive maintenance is often the simplest. It begins by making local diagnostics visible.
Modern variable frequency drives are among the best examples of built-in diagnostics. Beyond basic control, they continuously measure electrical and mechanical parameters that describe the system’s behavior in real time. Torque trends reveal when a conveyor belt is starting to drag. Motor current spikes show when a gearbox is seizing. DC bus fluctuations indicate line instability or grounding issues.
In one project, I worked with a plant that experienced random motor faults on a filler. Operators blamed software. Maintenance blamed the drive. It turned out that the supply voltage from a nearby transformer was dropping under load, causing undervoltage trips. The information was already available in the drive’s voltage register, but it had never been mapped. Once we brought that data into the local HMI, the team could see it immediately and call the utility before it caused another shutdown.
This is the value of diagnostic visibility. It turns guesswork into observation.
Smart sensors have brought the same philosophy to smaller devices. Many of them now embed temperature, vibration, or position feedback directly into the communication protocol. When used properly, this transforms the control system from a set of binary signals into a living, breathing representation of machine health.
Once local diagnostic data becomes visible, maintenance planning changes entirely. Instead of waiting for something to fail, technicians can intervene at the right time. Torque trending on a drive can be used to schedule lubrication. Temperature data from a bearing sensor can trigger inspection before a catastrophic failure. Even simple data, such as the number of motor starts or runtime hours, can be used to drive preventive maintenance cycles with precision.
In a food manufacturing plant I supported, we configured drives to report runtime hours directly to the PLC. The local system generated a small reminder on the HMI when a motor exceeded its service interval. It was not complicated, but it eliminated hundreds of hours of unplanned work annually because the maintenance team could plan downtime around real usage rather than fixed calendars.
Local diagnostic data also improves collaboration between engineering and maintenance. When everyone can see the same data in real time, the conversation shifts from speculation to evidence. The maintenance team stops chasing ghosts, and engineering gains the confidence that the system is behaving as designed.
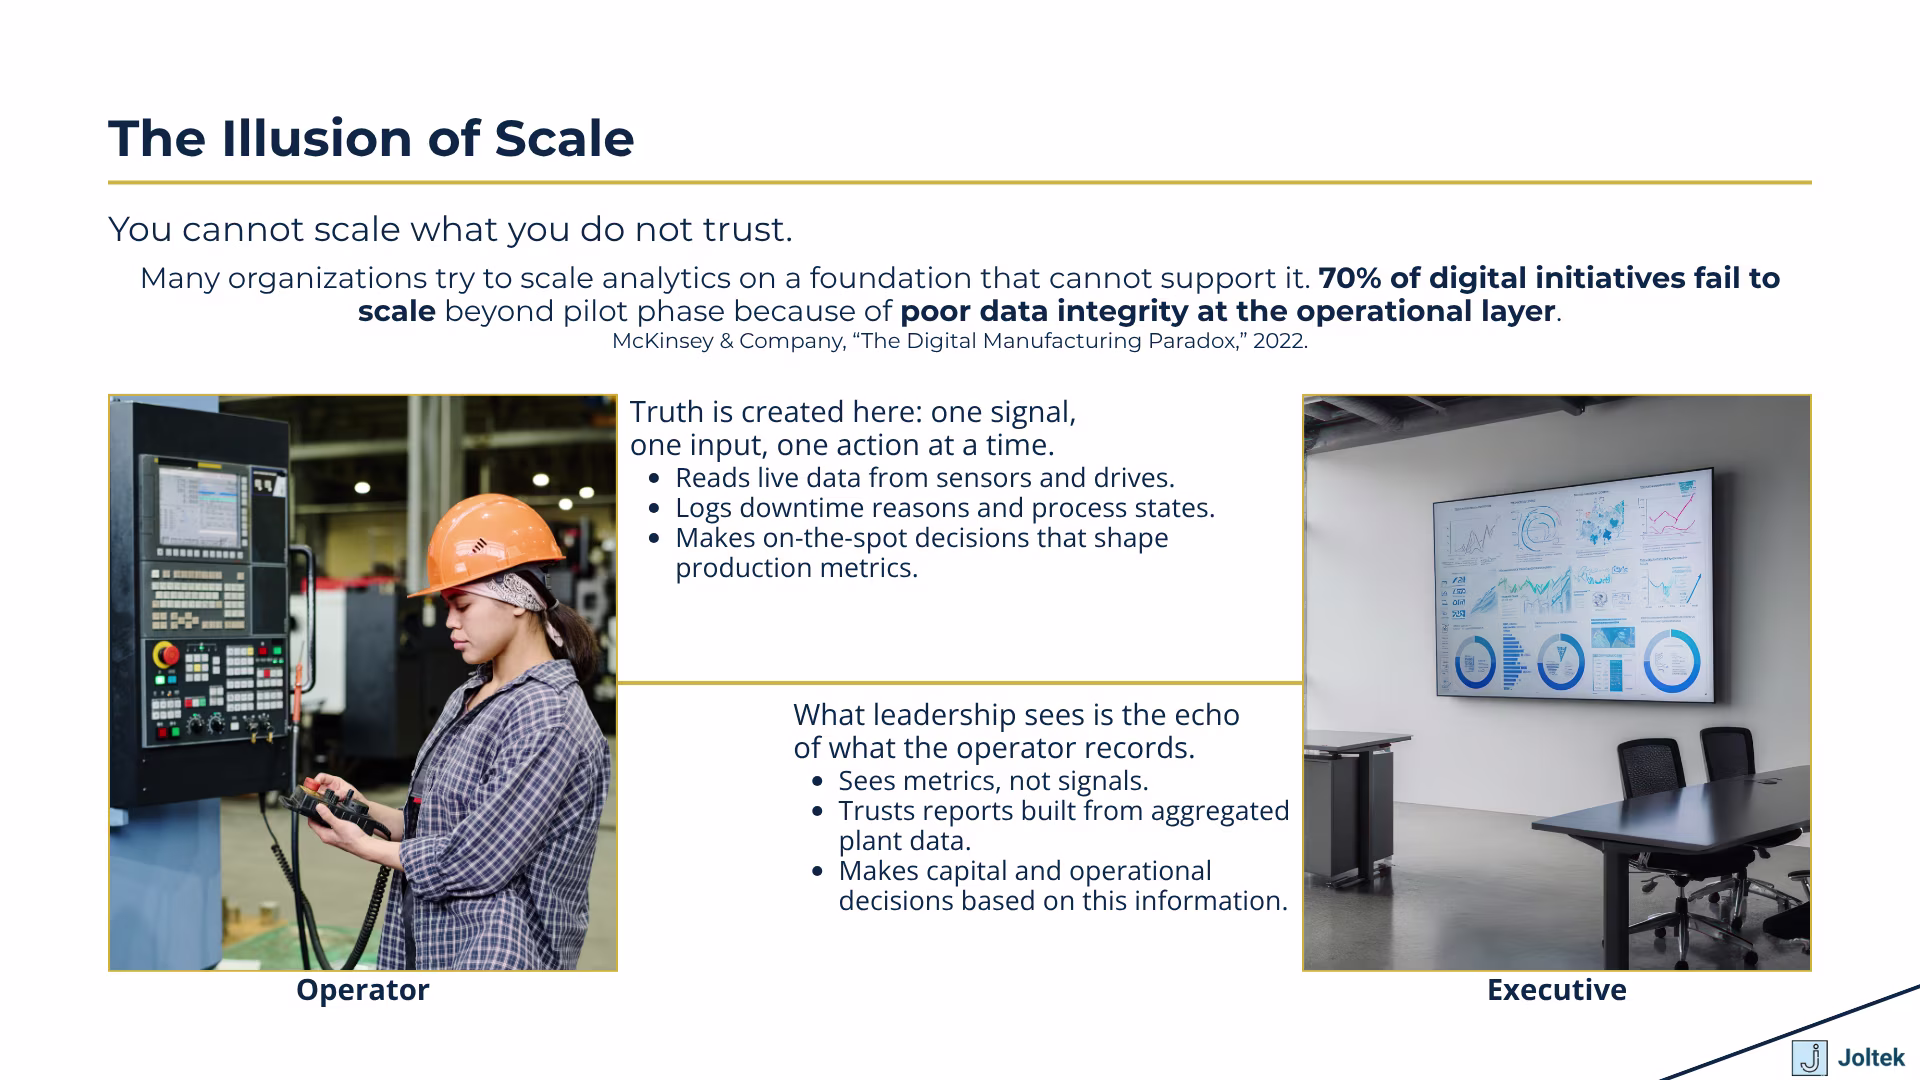
Once you start to see how much information exists at the local level, you realize that the quality of that data determines the quality of every other decision. The conversations in our industry often begin with big ideas like enterprise visibility or cloud analytics. But the truth is that none of those systems can make sense of data that lacks context. Local data gives that context. It defines what each value actually means and how it relates to the physical process.
In every manufacturing environment, the most valuable data is usually the simplest. It is not a complex model or algorithm, but a clear signal tied to something real. A properly named tag in a PLC, an alarm that describes the actual root cause, or a drive parameter that reflects true load conditions can create more impact on daily operations than any abstract KPI. These are the pieces of information that make the system understandable to the people running it.
When local data is inconsistent, the entire organization suffers. Operations struggles to see why a process is not performing. Maintenance reacts to symptoms instead of causes. Engineering cannot prove whether a change improved anything. Leadership ends up questioning the data itself. By contrast, when the local layer is structured and consistent, everyone across the plant speaks the same language. A stop reason in one area means the same thing in another. A temperature value, a torque reading, or a fault code all carry clear meaning.
For leaders, local data might seem like a technical concern, but it is the foundation of reliability and visibility. The cost of poor local data is rarely captured on a balance sheet, yet it appears every time a line goes down without a clear cause or when a report takes days to reconcile because no one trusts the inputs. The fastest way to improve uptime, reduce waste, and enable real analytics is to make sure the machines themselves communicate accurately.
When I walk through plants, I often see large digital programs underway. New dashboards are being designed, and data pipelines are being built. But on the floor, operators are still reading “Fault 9” on their HMIs with no explanation of what it means. Maintenance teams are resetting drives without knowing why they tripped. These are not small oversights. They are the reason large transformation efforts lose momentum. If people on the floor cannot act on the data in front of them, the initiative stalls before it reaches scale.
The real opportunity for decision-makers is not in adding more systems but in strengthening the foundation. A plant that invests in clean, reliable local data can scale confidently. A plant that ignores it will spend years chasing inconsistencies across every new platform it introduces.
Trust in data does not begin with the dashboard; it begins with the equipment. The moment an operator sees a screen that accurately reflects what they observe on the line, trust is created. When maintenance can confirm a fault reason without opening a panel, confidence grows. When engineers can tune a process and see immediate, traceable impact, data becomes an asset instead of a burden.
This local trust becomes the backbone of digital maturity. It creates a natural flow of accurate, contextual information upward to SCADA, MES, and analytics systems. Each layer above can now focus on insight rather than correction. The organization moves from reaction to understanding, from understanding to improvement, and from improvement to scale.
Modernization always starts at the source. Before a plant can optimize or automate, it must first understand itself. That understanding comes from local data. It is what reveals how the process behaves, how healthy the equipment is, and what actions need to be taken in real time. Digital transformation is not a leap into complexity. It is a disciplined focus on fundamentals. A well-structured control system, clear state logic, reliable configuration management, and meaningful diagnostics form the base of every successful initiative. Once those elements are in place, connecting to higher systems is simply a matter of choice.
Every manufacturer wants visibility, agility, and resilience. The path to those outcomes does not begin in the cloud. It begins on the floor. When the machines can explain what they are doing and why, the entire organization operates with confidence.
Local data is not a technical detail. It is the foundation of operational truth. It connects people to process, aligns teams around facts, and gives leaders a reliable view of performance. Before any system can be connected, before any data can be analyzed, it must first be understood. And that understanding always starts locally.
At Joltek, this is where every conversation begins. Before we talk about enterprise systems, we focus on the plant floor. We help manufacturers bring clarity to their local data so that operators, engineers, and executives all see the same picture. When that happens, the results follow naturally. Modernization becomes simpler, decisions become faster, and the organization finally moves with confidence in the information that drives it.

