
Insights
Manufacturing Digital Maturity Assessment for Food and Beverage Plants
A digital maturity assessment for food and beverage plants scores people, processes, technology and data, then ranks the gaps into a phased roadmap.

Table of contents
A manufacturing digital maturity assessment is a structured evaluation of where a plant stands across four dimensions (people, processes, technology and data) and which gaps to close first. For a food and beverage plant it also tests the records that food safety rules depend on: whether lot traceability, sanitation and preventive-control records can be produced quickly and trusted. The output is a scored baseline and a phased roadmap that leadership can fund.
Why a Digital Maturity Assessment Matters
Every manufacturing plant is on a journey toward digital transformation, but not every plant knows where it truly stands. For mid-market food and beverage manufacturers, the challenge is often magnified by limited resources, legacy infrastructure, and strict compliance requirements. This is why a digital maturity assessment is one of the most important tools available today. It reveals the current state of people, processes, and technology, while identifying the most strategic next steps.
Without a structured assessment, companies risk investing in the wrong projects, overlooking critical risks, or failing to align leadership teams around a common vision. With margins under pressure and competition intensifying, understanding digital maturity is no longer optional. It is the foundation for building a resilient, efficient, and future-ready operation.
What Is a Digital Maturity Assessment in Manufacturing
A digital maturity assessment is a structured evaluation of how advanced a facility is across people, process, and technology. It looks at current capabilities, cultural readiness, and technical systems together, so the plant sees its transformation potential as one picture rather than a set of separate audits. Unlike a standard audit that focuses only on compliance or production numbers, a maturity assessment highlights both opportunities and risks.
For mid-market manufacturers, this tool creates a roadmap that links business goals with practical initiatives. It allows plant managers to communicate with executives and align on investment priorities that deliver measurable value.
Why Mid-Market Food and Beverage Plants Face Unique Challenges
Mid-market food and beverage plants often operate with lean resources compared to global multinationals, yet they face the same regulatory pressures. They may be running equipment that is twenty years old alongside new automation platforms, creating a fragmented environment. Compliance with food safety regulations like HACCP and FSMA requires accurate data, but many facilities still rely on spreadsheets or paper records.
In addition, workforce turnover is a pressing issue. Skilled technicians are hard to retain, and training is often reactive rather than proactive. When combined, these factors make digital transformation appear daunting. A maturity assessment helps demystify the process by breaking down the path into achievable steps. Our food and beverage industry page covers the wider set of automation and data problems these plants face.
Food and Beverage Realities a Digital Maturity Assessment Must Test
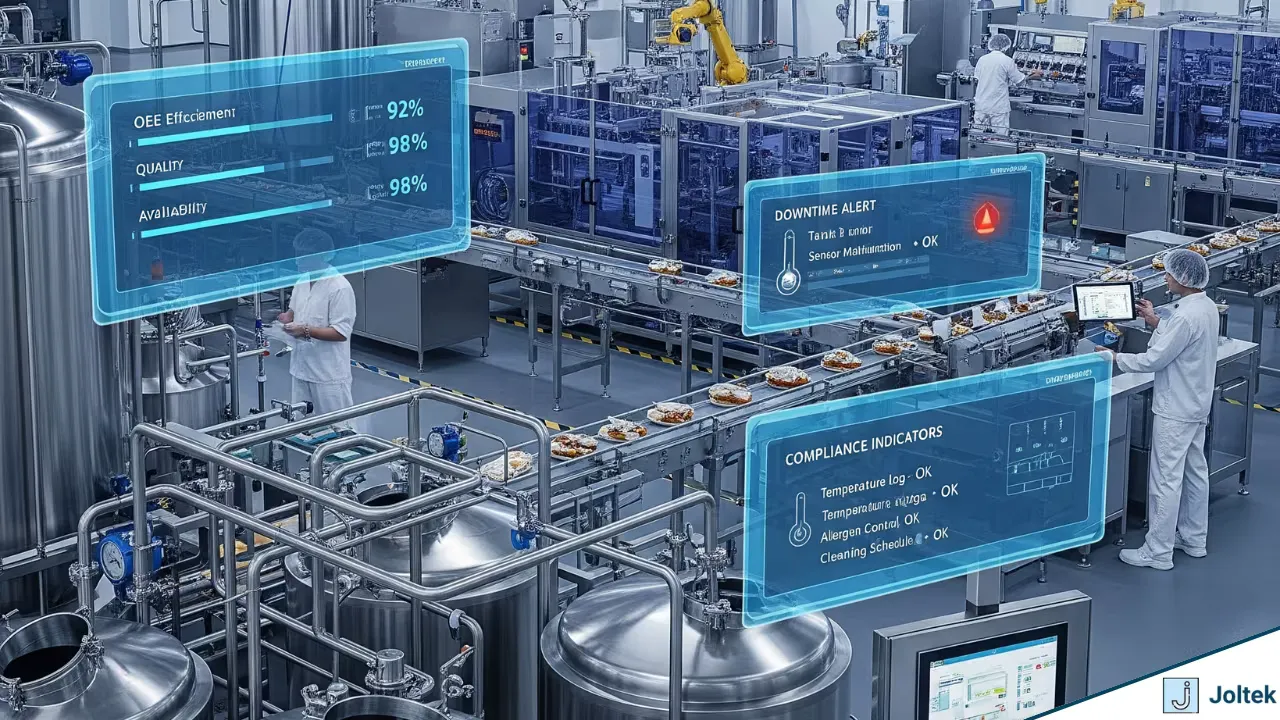
A generic maturity model scores a food plant the same way it scores a machine shop. Three realities make food and beverage different, and a useful digital maturity assessment tests each of them directly.
Traceability records under FSMA 204. The FDA’s Food Traceability Rule (21 CFR Part 1, Subpart S) applies to foods on the Food Traceability List and to foods that contain them as ingredients. Firms that manufacture, process, pack or hold those foods must keep key data elements (KDEs) for defined critical tracking events (CTEs): harvesting, cooling, initial packing, first land-based receiving of seafood, shipping, receiving and transformation. When a plant transforms a listed food, it must assign a new traceability lot code and link it to the lot codes and quantities of the inputs it used. The rule also requires a written traceability plan, and records must be produced for the FDA within 24 hours of a request, for most firms as an electronic sortable spreadsheet. The original compliance date was January 20, 2026; as of October 2026, the FDA says Congress has directed it not to enforce the rule before July 20, 2028. The extra time is useful only if the plant uses it. An assessment asks a blunt question: could this plant produce that spreadsheet for one lot today, and how many people and systems would it take?
Preventive-control records. Under the Preventive Controls for Human Food rule (21 CFR Part 117), a facility keeps records of monitoring, corrective actions and verification for its process, allergen and sanitation controls. Those records must contain the actual values observed and be created at the time of the activity. A temperature log filled in at the end of a shift fails that test, however neat it looks. The assessment checks where each record is created, by whom, and whether the value comes from an instrument or from memory. Part 117 records kept electronically to satisfy that rule are exempt from the FDA’s Part 11 electronic records rule, though records also required under other regulations remain subject to it, which matters when choosing a system.
Sanitation and washdown. Food plants clean their equipment on a schedule that production has to work around, and in wet areas that means water, chemicals and high-pressure hoses near panels, HMIs, sensors and cabling. That constrains the technology dimension: a tablet or industrial PC that works in a dry packaging hall may not survive a washdown zone, and every enclosure penetration is a place for water to get in. Sanitation is also a data source. Clean-in-place cycles, sanitation sign-offs and allergen changeovers all generate records, and in a less mature plant they live on paper next to the line. An assessment that ignores sanitation misses both a hardware constraint and one of the plant’s largest sets of manual records.
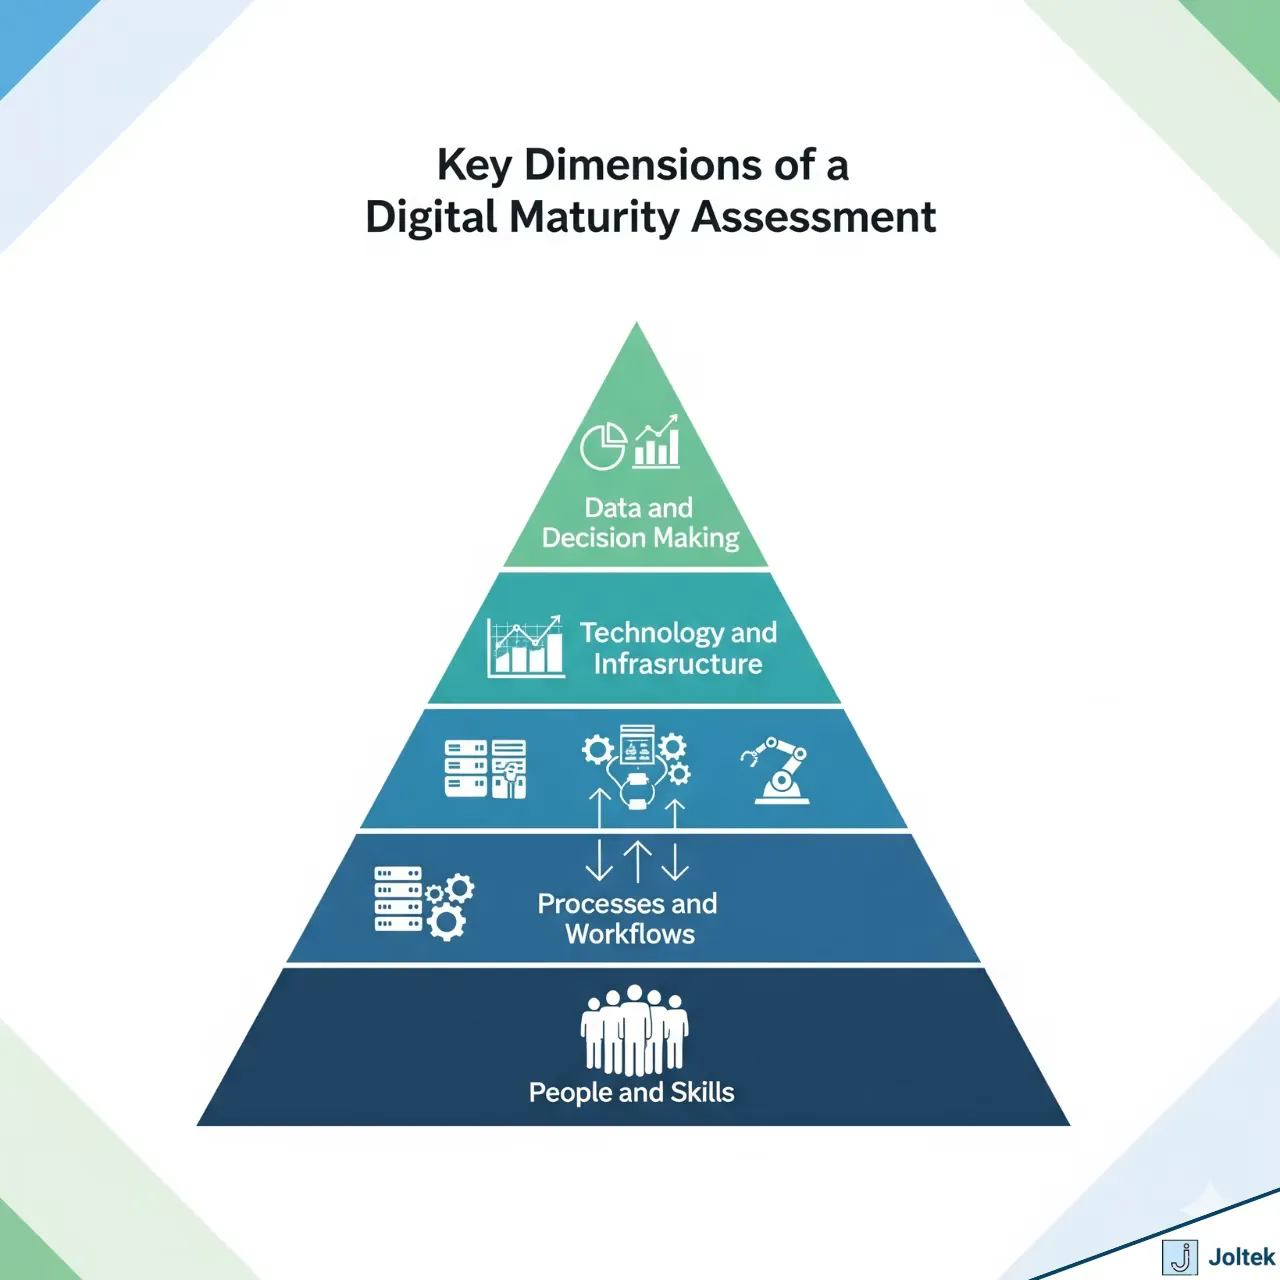
Key Dimensions of a Manufacturing Digital Maturity Assessment
People and Skills
The workforce is the backbone of any plant. An assessment examines whether teams have the right mix of technical knowledge, process discipline, and digital literacy. For example, operators may be skilled in running machines but lack training in analyzing data from SCADA or MES systems.
Actionable Insight: Measure the percentage of staff trained on core digital systems, and identify gaps that could be closed through targeted education programs.
Processes and Workflows
Processes dictate how efficiently production runs and how consistently quality is maintained. A maturity assessment looks at whether standard operating procedures are documented, enforced, and improved upon. It also evaluates whether lean or TPM principles are embedded into the daily rhythm of the plant.
Actionable Insight: Benchmark the number of documented processes against industry best practices, and identify whether workflows are being continuously improved or only updated reactively.
Technology and Infrastructure
Technology is often the most visible aspect of maturity. Assessments examine automation systems, SCADA platforms, MES deployments, and ERP integrations. They also look at obsolescence risk. A plant may have legacy PLCs nearing end of life, which could create hidden liabilities. Where batch records, recipes and genealogy are in scope, the assessment also looks at the MES and batch layer and how it connects to the controls below and ERP above.
Actionable Insight: Create an inventory of all critical control systems, classify them by lifecycle stage, and map modernization priorities to operational risk.
Data and Decision Making
True digital maturity comes from using data to drive decisions. Many plants collect large volumes of information, but very few transform it into actionable insights. Assessments focus on how data is captured, stored, contextualized, and shared between teams. Our overview of plant data covers the historians, context models and integration patterns behind a mature data layer.
Actionable Insight: Evaluate the number of real-time dashboards available on the plant floor, and measure whether data is being used in daily decision making.
An Illustrative Scoring Rubric for the Four Dimensions
Scoring makes the four dimensions comparable and gives the plant a baseline to re-score later. The rubric below is illustrative: it shows the kind of evidence that separates one level from the next, and should be adapted to the plant’s products, regulations and systems rather than used as a published standard.
| Dimension | Level 1: Basic | Level 2: Developing | Level 3: Integrated | Level 4: Data-driven |
|---|---|---|---|---|
| People and skills | Training by shadowing; knowledge held by a few people | Role-based training exists but not for digital systems | Operators and technicians trained on SCADA, MES and dashboards, and use them daily | Teams run improvement from data; a skills matrix is kept current |
| Processes and workflows | SOPs missing or out of date; paper forms | SOPs documented, updated after problems | SOPs enforced in systems; lean or TPM in the daily rhythm | Changes measured against results and improved continuously |
| Technology and infrastructure | No system inventory; unsupported PLCs and PCs | Inventory exists and obsolescence is known | Lifecycle-managed systems; SCADA and MES connected to ERP | Modernization planned against risk on a standard architecture |
| Data and decision making | Data on paper or re-keyed into spreadsheets | Data collected but held in silos | Real-time, contextualized dashboards at the line | Decisions and traceability requests answered from trusted data on demand |
How a Digital Maturity Assessment Runs
The steps below describe what happens at each stage and what it produces. Duration depends on the size of the plant and how quickly data and people are available, which is why the table does not put a number on each step.
| Step | Who takes part | What happens | Output |
|---|---|---|---|
| 1. Objectives and scope | Plant or business leadership, the assessment lead | Agree the business outcomes the assessment serves (for example reduced downtime or compliance readiness), the lines and systems in scope, and the sponsor | A one-page charter and the cross-functional team |
| 2. Interviews | Operators and supervisors on each shift, maintenance, quality, engineering, IT | Structured conversations about how work really gets done, where data is re-keyed, and which workarounds people rely on | Interview notes tagged by dimension |
| 3. Site walk and inventory | Assessment lead with engineering and maintenance | Walk the production and sanitation areas, list every control and information system with its lifecycle status, and sample traceability, monitoring and sanitation records | A system inventory and a record-sampling log |
| 4. Scoring and gap analysis | The cross-functional team | Score each dimension against the rubric, then rank each gap by operational and compliance risk | A scored baseline and a ranked gap list |
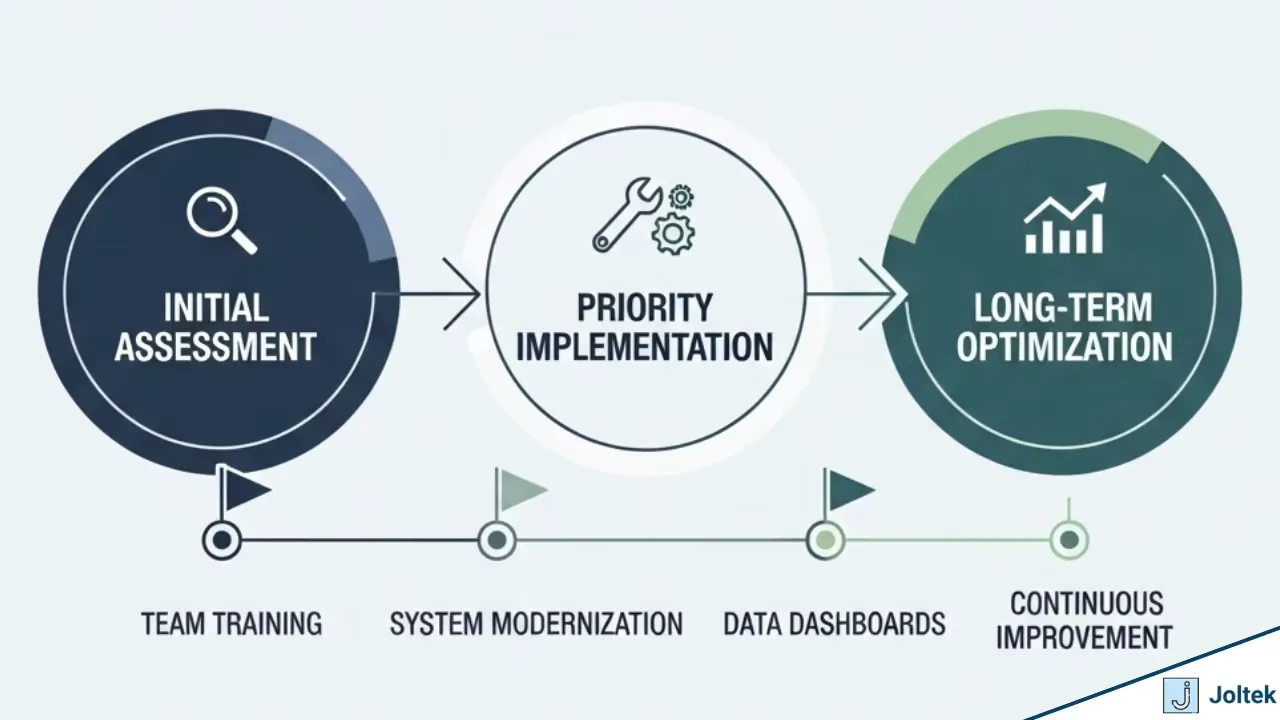
| 5. Roadmap | Leadership and the team | Prioritise initiatives by impact and feasibility and group them into phases with owners | A phased roadmap leadership can fund, and the date of the first review |
Two behaviours separate a useful assessment from a report that sits in a drawer. First, it samples evidence rather than relying on interviews alone: a record pulled from a real lot settles arguments that opinions cannot. Second, it ends with owners and dates, not only recommendations. If the plant wants the roadmap built with outside help, a modernization roadmap engagement takes the scored gaps and turns them into phased, costed projects.
Case Study: How an Assessment Transformed a Food Packaging Facility
A mid-market food packaging plant in North America struggled with inconsistent line performance and frequent downtime. They initiated a digital maturity assessment that revealed three critical issues: lack of operator training, outdated servo systems, and no centralized performance dashboards.
By prioritizing these areas, the plant invested in targeted operator upskilling, migrated obsolete motion control systems, and deployed a lightweight SCADA dashboard. Within twelve months, OEE improved by 12 percent and downtime was reduced by 18 percent. This case illustrates how an assessment can identify high-impact changes without overwhelming the organization.
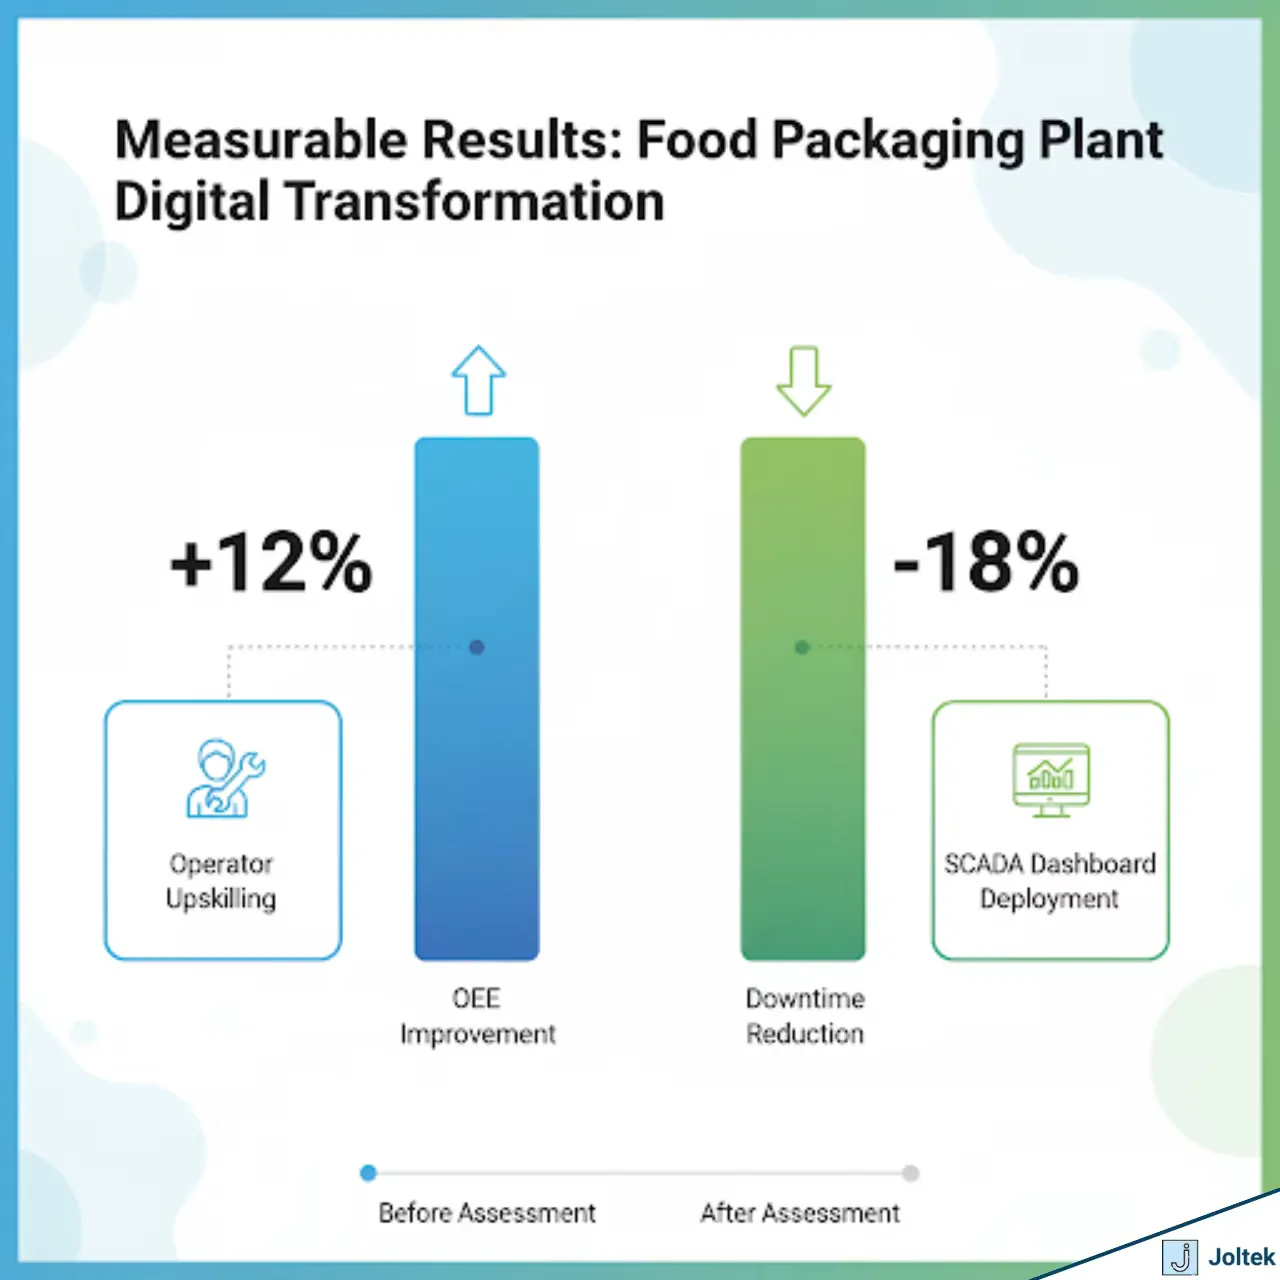
Notice that the three findings land in three different dimensions: people (training), technology (obsolete servo systems) and data (no dashboards). That spread is typical of what a four-dimension assessment is designed to surface, and it is why a plant that only audits its equipment tends to fund the migration and miss the training. For a deeper look at the downtime side of that story, see our guide to manufacturing downtime.
Common Risks Revealed by Assessments
The same handful of risks appears in most food and beverage assessments. The table connects each to the reason it matters and the evidence an assessment looks for.
| Risk | Why it matters in a food plant | What the assessment checks |
|---|---|---|
| Legacy control systems without vendor support | A failure becomes an extended outage when spares and expertise are gone | System inventory with lifecycle status and spare-parts position |
| Paper-based compliance processes vulnerable to errors | Monitoring and traceability records must be accurate, concurrent and quickly retrievable | Sampled records: when each was written, by whom, and how long retrieval takes |
| Lack of standardized training programs across shifts | Each shift runs the line differently, and quality varies with it | Training records by role and shift; interview answers compared across shifts |
| Data silos preventing accurate reporting | OEE, downtime and quality numbers disagree depending on who reports them | How many systems hold production data and how many manual transfers sit between them |
| Single points of failure in critical production equipment | One machine or one person can stop the plant | Critical-equipment list, redundancy, and who can troubleshoot each system |
Each of these risks can significantly erode profitability and increase compliance exposure. Identifying them early is key to avoiding unplanned downtime or costly regulatory penalties.
Actionable Steps for Conducting Your Own Assessment
- Define clear objectives aligned to business outcomes such as reduced downtime or improved compliance.
- Assemble a cross-functional team that includes operations, IT, engineering, and quality.
- Use a structured framework to evaluate people, processes, technology, and data.
- Document findings in a way that can be communicated to both executives and operators.
- Prioritize initiatives based on impact and feasibility, creating a phased roadmap.
- Review progress quarterly and adjust as new risks or opportunities emerge.
A Self-Assessment Checklist for Food and Beverage Plants
Before committing to a full digital maturity assessment, a plant team can answer these questions in an afternoon. Every “no” or “not sure” is a candidate finding.
- Could we produce, within 24 hours, an electronic sortable spreadsheet of the key data elements for one lot of a food on the FDA’s Food Traceability List?
- When we transform an ingredient into a product, is the link from input lot codes to the new lot code recorded by a system, or reconstructed by hand?
- Are preventive-control monitoring records (temperatures, metal detection, allergen checks) created at the time of the activity, with the actual values?
- Do sanitation and clean-in-place records live in a system we can search, or on paper at the line?
- Do we have a current inventory of every PLC, HMI, SCADA server and industrial PC, with its support status?
- Is the hardware in washdown areas rated and installed for the cleaning it gets?
- Are operators on every shift trained to use the dashboards and systems we already own?
- Do OEE and downtime figures agree between production, maintenance and finance?
- Is there a named owner for each critical system, and a second person who can troubleshoot it?
- Does leadership have a written, prioritised list of the next three improvement projects?
Comparison: Digital Maturity Models Used in Manufacturing
Several maturity models are commonly referenced in manufacturing, including the ISA-95 model, the Industrie 4.0 Maturity Index, the Smart Industry Readiness Index, and custom frameworks developed by consulting firms. Each has its strengths, but for mid-market food and beverage plants, the most effective models are those that balance technical evaluation with cultural readiness. The table compares them on the same dimensions.
| Industrie 4.0 Maturity Index | Smart Industry Readiness Index (SIRI) | ISA-95 | Custom assessment | |
|---|---|---|---|---|
| Published by | acatech (German National Academy of Science and Engineering); update published 2020 | Singapore Economic Development Board (EDB), with INCIT | International Society of Automation; also published as IEC 62264 | The consultant or the plant itself |
| What it is | A maturity model for digital transformation | A self-diagnostic Industry 4.0 readiness tool | An integration standard between enterprise and control systems, not a maturity model | A framework built for the plant’s goals and regulations |
| Structure | Four structural areas: resources, information systems, culture, organisational structure; applied across functional areas from development to production, logistics, services and sales | Three building blocks (process, technology, organisation), eight pillars, sixteen dimensions | Levels from the physical process (Level 0) to business planning and logistics (Level 4), with models for the Level 3 to Level 4 interface | Usually people, processes, technology and data, as on this page |
| Scale | Six stages: computerisation, connectivity, visibility, transparency, predictive capacity, adaptability | Six bands of maturity per dimension | No maturity scale | Set by the assessor; four or five levels is common |
| Best use for a mid-market food plant | Shows that culture and organisation must move with technology | A quick, structured self-check with a prioritisation step | A map of the technology dimension: which system owns which function, from PLC to ERP | Adding food-specific tests such as FSMA traceability, preventive-control records and sanitation |
In short:
- ISA-95 emphasizes technology layers from PLC to ERP. It tells you where a function belongs, not how mature it is.
- The Industrie 4.0 Maturity Index introduces cultural and organisational dimensions, and its stages build on each other in order.
- SIRI gives a standard self-diagnostic and a prioritisation matrix that helps decide which dimensions to tackle first.
- Custom assessments can tailor benchmarks to specific regulatory requirements, which is where food-specific rules come in.
Frequently Asked Questions About Digital Maturity Assessments
What is the difference between a maturity assessment and an audit?
An audit checks compliance with a specific standard at a point in time, such as a food safety scheme or a customer requirement, and produces findings to close. A digital maturity assessment evaluates how ready the plant’s people, processes, technology and data are for future growth and transformation, and produces a prioritised roadmap. The two complement each other: audit findings are useful inputs to an assessment.
How long does a digital maturity assessment take?
Most mid-market plants can complete an assessment within four to six weeks, depending on complexity and data availability. The time goes into interviews across shifts and functions, a walk of the production areas, building an inventory of control and information systems, and turning the findings into a scored, phased roadmap that leadership can approve.
Who should lead the digital maturity assessment?
A cross-functional team is ideal: operations, engineering, maintenance, quality and IT, with a sponsor from plant or business leadership who owns the outcome. Bringing in a third-party consultant ensures objectivity and broader industry benchmarks, and it helps people speak openly about workarounds they would not raise with their own management.
How do we measure success after the assessment?
Success is measured by the implementation of prioritised actions and the business outcomes achieved, such as higher OEE, less unplanned downtime or improved compliance readiness. Record a baseline for each target during the assessment, assign an owner to every roadmap item, and re-score the four dimensions at a regular review so progress is visible to leadership.
Can small plants benefit from a maturity assessment?
Yes. Even small facilities can gain significant insights, especially when modernization investments need to be carefully prioritised. A smaller plant has fewer systems to inventory and fewer people to interview, so the assessment is shorter, but the value is the same: knowing which gaps carry the most operational and compliance risk before spending money.
Start the Digital Maturity Assessment With the Records, Not the Software
A digital maturity assessment earns its cost when it changes what the plant funds next. For a food and beverage plant, the fastest way to make it concrete is to start with the records the business already depends on: one lot traced end to end, one day of monitoring records, one sanitation cycle. Those samples show the true state of people, processes, technology and data faster than any questionnaire. If you want an independent view, our plant systems assessment covers the control, data and network layers of a plant and ends with a ranked list of what to fix first.
References and further reading
- Industrie 4.0 Maturity Index. Managing the Digital Transformation of Companies, UPDATE 2020 · acatech, National Academy of Science and EngineeringSix development stages across four structural areas: resources, information systems, culture and organisational structure.
- The Smart Industry Readiness Index · Singapore Economic Development Board (EDB)Three building blocks, eight pillars and sixteen dimensions, each scored in six bands.
- ISA-95 Standard: Enterprise-Control System Integration · International Society of Automation (ISA)
- FSMA Final Rule on Requirements for Additional Traceability Records for Certain Foods · U.S. Food and Drug AdministrationThe Food Traceability Rule: critical tracking events, key data elements and the July 20, 2028 enforcement date.
- 21 CFR Part 1, Subpart S: Additional Traceability Records for Certain Foods · Electronic Code of Federal Regulations
- FSMA Final Rule for Preventive Controls for Human Food · U.S. Food and Drug AdministrationThe rule behind the monitoring, corrective-action and verification records an assessment should test.