
Insights
Manufacturing Downtime: Causes, Hidden Costs, and Strategies to Reduce Unplanned Stops
Manufacturing downtime explained: what counts as downtime, the most common causes, the hidden costs beyond lost output, and how to reduce unplanned stops.
Table of contents
Manufacturing downtime is any time a machine, line or plant is not producing when it is scheduled to, and unplanned downtime is the part that does the damage. It usually starts small: an operator stop, a sensor trip, a frozen HMI or a network glitch. Because machines are linked, one stop starves everything downstream and blocks everything upstream once the buffers run out, so a single fault becomes a line outage. The real cost is far larger than lost output once labor, scrap, logistics and customer trust are counted. Reducing it starts with recording every stop against its true cause, then dealing with the largest causes: reactive maintenance, missing spares and backups, obsolete controls and unmonitored networks.
Introduction
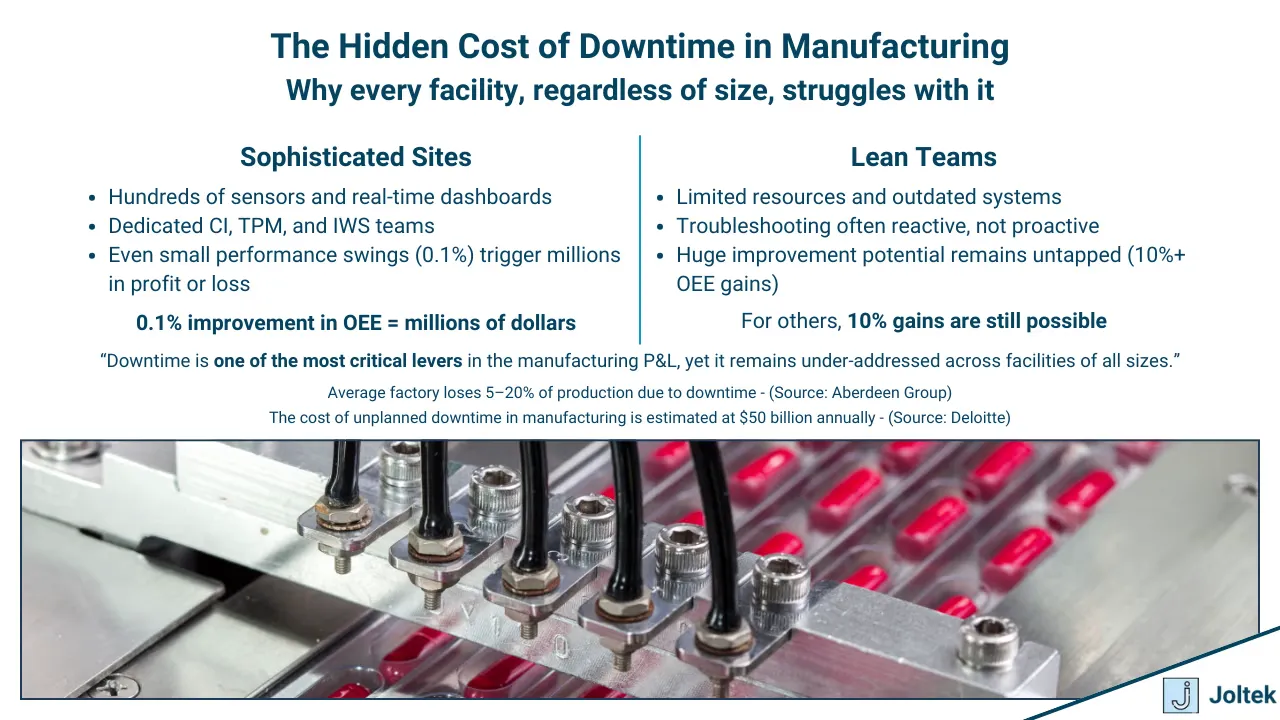
I have spent the last decade working inside manufacturing facilities of all sizes. I have been to small plants where a handful of people kept operations running through sheer persistence, and I have also walked the halls of highly sophisticated IWS 4 sites at Procter and Gamble where nearly every system was meticulously documented. Despite the wide range of maturity levels, one truth has been consistent. Downtime is the problem every facility is trying to solve. For some organizations, a tenth of a percent improvement in OEE translates into millions of dollars in value. For others, the opportunity lies in double digit improvements where even basic changes create measurable impact. What unites all of them is the shared understanding that downtime has a direct effect on the profit and loss statement. In other words, every hour of lost production is an hour of capital being eroded.
My goal in this post is to share a perspective that comes directly from years of practical exposure. I want to highlight what downtime really is, how it manifests on the plant floor, the most common causes, and how you can capture and act on it in a meaningful way. Just as importantly, I want to share what I have actually seen move the needle in reducing downtime and improving plant reliability. Manufacturing is vast, with verticals that differ greatly in complexity, technology, and readiness. Your facility might not face the exact same issues as another, but my hope is that the lessons are broad enough to apply regardless of your role or plant type.
What Is Manufacturing Downtime
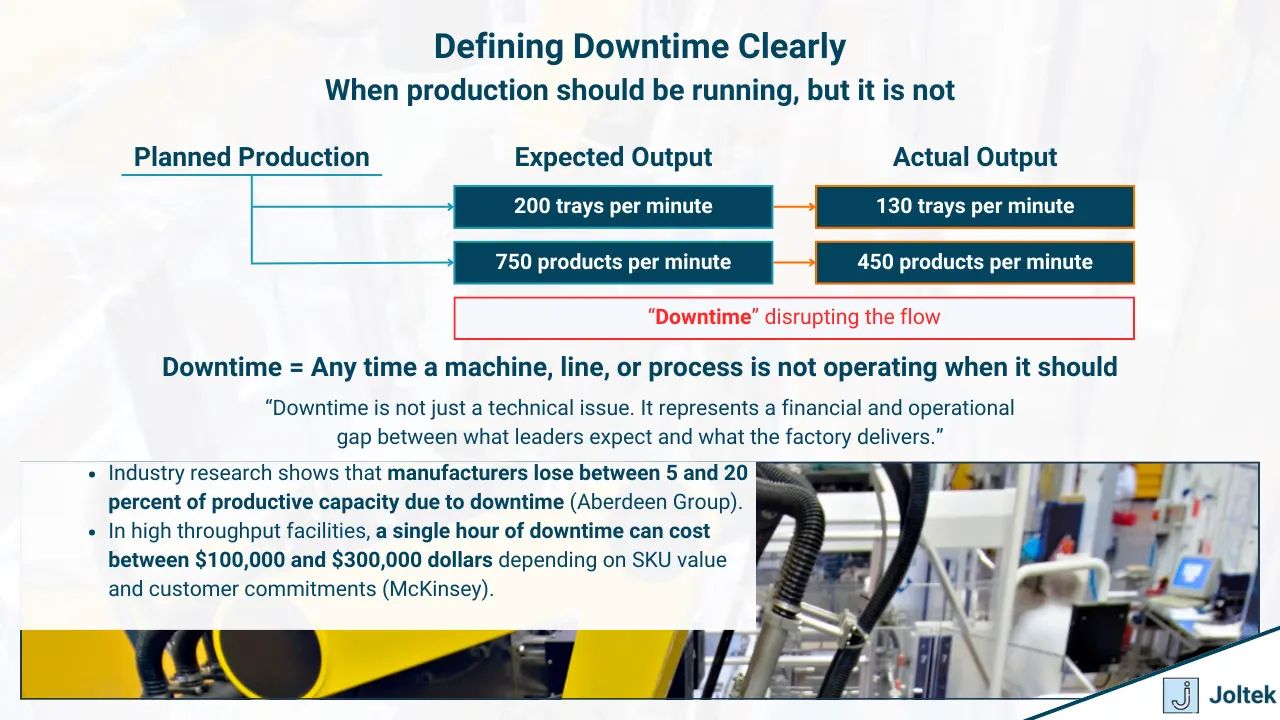
Downtime in its simplest form is the period when a machine, a line, a process, or even the entire facility is not operating when it is expected to. That expectation matters. Production schedules are built around demand, and lines are assigned specific SKUs to run. Operators are tasked with turning raw material into finished goods at a given rate. In many of the facilities I have worked in, that rate was defined by targets such as two hundred trays per minute or in some cases seven hundred and fifty products per minute. These speeds were never absolute. They represented ideals built from historical best runs. The reality is that no production chain runs in perfect equilibrium. One machine may be capable of moving at that rate, while another may struggle to keep up. The gap between expectation and reality is where downtime begins to take root.
Downtime is not just a technical definition. It represents a breach of trust between what leadership expects from its assets and what those assets can actually deliver. It is the space where profitability is lost and where reliability is tested.
Not every lost minute is the same kind of loss. Most plants that measure overall equipment effectiveness (OEE) sort losses into the categories below, although the exact conventions vary from site to site and should be written down. For how a food or beverage plant can measure those losses per machine rather than only per line, see OEE in food and beverage manufacturing.
| Type of loss | Examples | Planned or unplanned | Where it usually lands in OEE |
|---|---|---|---|
| Scheduled stops | Preventive maintenance, sanitation, planned upgrades | Planned | Often excluded from planned production time |
| Changeovers | SKU or format changes, setup and adjustment | Planned, but overruns are not | Availability |
| Breakdowns and trips | Mechanical or electrical failure, sensor and interlock trips | Unplanned | Availability |
| Blocked and starved | Machine ready but no product in, or no room out | Unplanned, caused elsewhere | Availability, attributed to the machine that caused it |
| Micro-stops and slow running | Brief jams, resets, running below rated speed | Unplanned | Performance |
| Quality losses | Scrap, rework, startup rejects | Unplanned | Quality |
Downtime and Bottlenecks
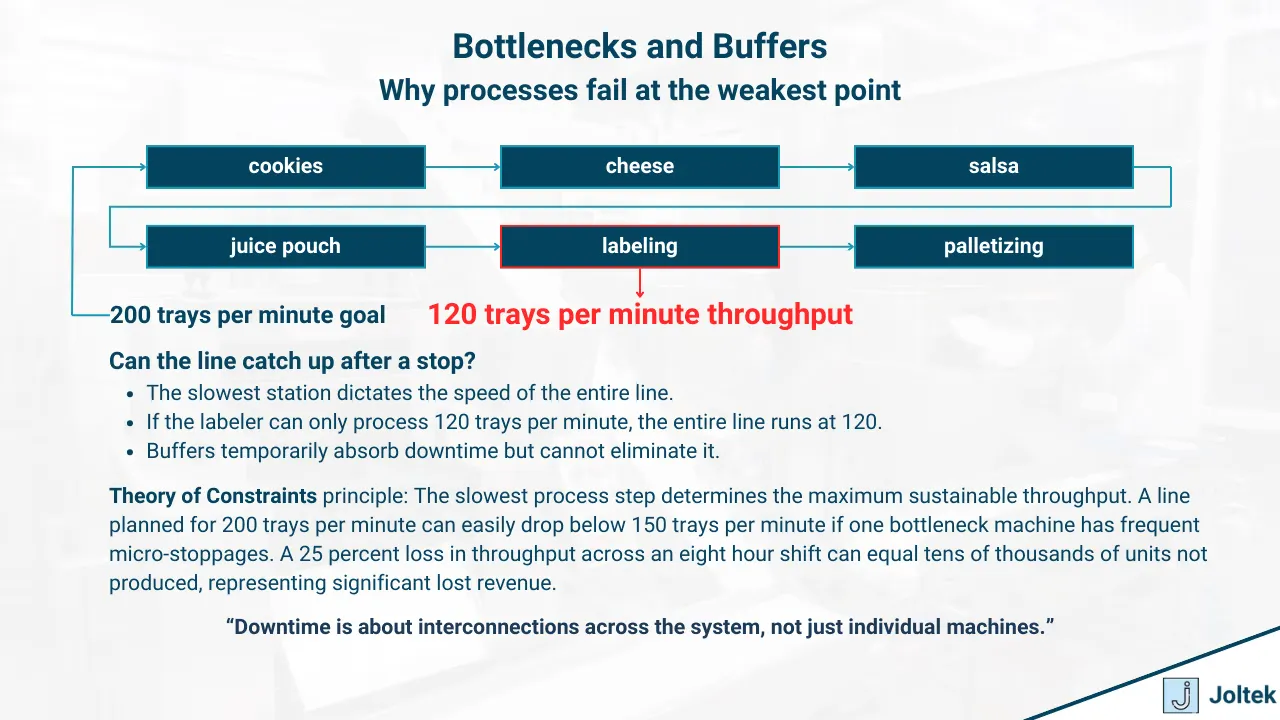
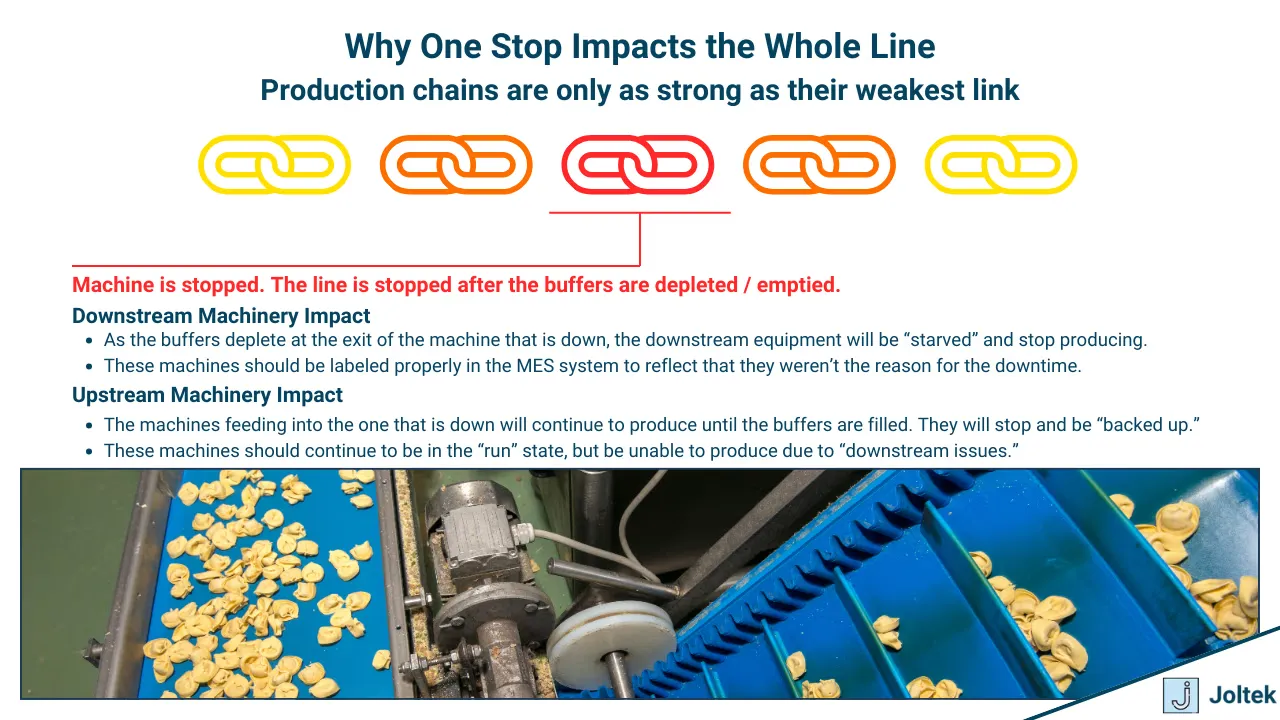
Bottlenecks are often misunderstood on the plant floor. Let us return to the earlier example of producing two hundred trays per minute. Each tray may need multiple components added: cookies, cheese slices, salsa, and a pouch of juice. After that, it needs labeling, casing, and palletizing. At first glance, the bottleneck could be anywhere, and in practice, it shifts depending on how buffers are designed.
A buffer is one of the most underappreciated tools in managing downtime. If two hundred trays can accumulate before the case packer, then a temporary stoppage upstream might not immediately impact final output. The line can catch up by running faster than the bottleneck once it restarts. Without that buffer, the same stoppage causes production to halt completely. Similarly, if a pouch sealer goes down and no buffer exists, the entire line grinds to a stop because the tray cannot be filled. Packaging can sometimes be bypassed or rerouted to a different line, but that requires foresight in system design.
The lesson here is that downtime is not just about machines failing but about how processes are interconnected. Bottlenecks reveal themselves only when you zoom out and look at the entire flow, not when you focus on a single piece of equipment.
How Downtime Impacts Production
In most plants, downtime translates directly into lost production. Without well designed buffers and operational strategies, a single machine going offline will stop an entire line. Every lost minute adds up. This means that in environments where utilization is already high, the plant does not just lose product, it loses the ability to recover. That is why organizations spend so much effort on preventive maintenance, redundancy, and systems planning. They are not only protecting assets, they are protecting output that cannot be recaptured once it is gone.
What Causes Downtime
The causes of downtime are many, but only the most advanced facilities track them with precision. In those plants, tools are in place to measure performance, availability, and efficiency, and to attribute downtime to root causes. In most facilities, however, attribution is poor. This makes it difficult for leadership to make informed decisions because no one truly understands what is driving losses.
From my experience, the common causes fall into a few recognizable categories. Operator stops are among the most frequent. An operator notices something off and presses stop, sometimes on the main control or even an emergency stop. Machines are also equipped with sensors that halt operation. These sensors may protect product quality, such as temperature or weight limits. They may protect the machine itself, such as current overload or pressure thresholds. They may protect operators through safety circuits and interlocks. In many cases they serve more than one function at once.
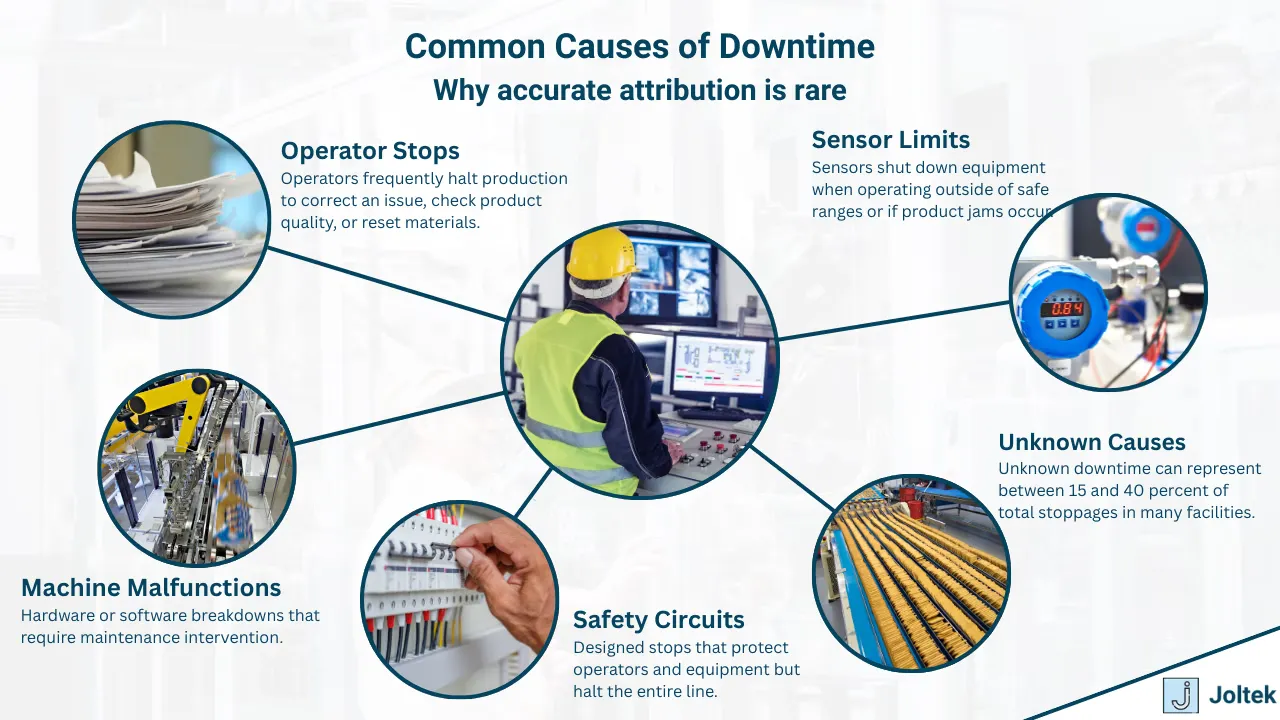
What this means is that downtime is not always the result of a breakdown but of systems doing exactly what they were designed to do. They intervene when a parameter crosses a limit, and while this protects quality, equipment, and people, it also means production stops until the issue is resolved.
What Manufacturing Downtime Really Costs
At nearly every site I have worked in, leadership understood the cost of downtime at least at a surface level. If a case sells for thirty dollars and the line produces a thousand cases per hour, then each hour of downtime equals thirty thousand dollars in lost revenue. This type of math is often shared in meetings and used to justify investments.
What is less obvious are the hidden costs. In food and chemical plants, downtime may force shifts in production schedules, require raw ingredients to be scrapped or reallocated, or lead to lost contracts when commitments cannot be met. Labor is also impacted, since staff must be paid whether or not machines are running. At the end of the quarter, the true cost emerges in the profit and loss statement, often surprising leaders who believed the issue was under control.
The lesson is clear. Downtime is not a single line item but a multiplier of costs across production, labor, supply chain, and customer relationships. A short stoppage may be manageable, but as time extends the impact grows exponentially.
How Obsolescence Creates Hidden Risks
When most people think of downtime, they picture a machine breaking down or a sensor failing unexpectedly. In reality, some of the most severe events I have witnessed were not caused by sudden mechanical failures but by systems that had simply aged beyond their useful life. A controller running outdated firmware, an HMI that can no longer boot, or a network switch that has been quietly degrading for years can all bring production to a standstill. The hidden risk with obsolete equipment is not just that it fails more often but that recovery takes dramatically longer.
Why Older PLCs and HMIs Matter
I have seen plants still running on PLCs that vendors stopped supporting more than a decade ago. On the surface, these machines still function. The problem comes when they fault. There are no replacement parts on the shelf, and if spares exist they are often secondhand or pulled from decommissioned equipment. The same is true for HMIs. When an old operating system fails, teams scramble to find compatible software that is no longer licensed or supported. What could have been a simple swap in a modern environment becomes an extended outage because the building blocks of recovery are missing. Our Rockwell PLC lifecycle and migration guide shows how to read a vendor’s lifecycle status before this happens.
When Networks and Drives Become the Weak Links
Control systems are only as strong as the infrastructure around them. Network switches, drives, and power supplies all age with time. In many facilities, the network is flat and unsegmented, which means a single failure or misconfiguration can take down multiple lines at once, a pattern we explain in industrial Ethernet reliability. Drives are another overlooked area. When a drive fails on an obsolete model, sourcing a replacement becomes an exercise in luck rather than planning. Obsolescence turns everyday failures into prolonged stoppages because the plant no longer has the tools to recover quickly.
Why Recovery Takes Longer
In theory, any failure can be fixed. In practice, obsolete systems stretch recovery timelines far beyond what is acceptable. I have seen outages extend from minutes to days simply because backups were missing or outdated. Documentation might be incomplete, or it might not exist at all. Often, only one or two individuals understand how the system truly works. If they are unavailable, the plant is stuck waiting. Lead times for obsolete parts can extend into weeks, leaving leadership with no choice but to pay premium pricing for expedited shipments or to make unplanned capital investments just to get production moving again. Automated PLC backup software and version control exist precisely to remove the missing-backup part of that delay.
The Compounding Effect of Obsolescence
Every additional year that aging systems remain in operation increases both the probability of failure and the severity of the consequences. What used to be a small inconvenience can evolve into a plant wide disruption. Insurance providers have started to recognize this, with some increasing premiums for companies that continue to rely on unsupported equipment. More importantly, customers recognize it when shipments are delayed. Obsolescence compounds risk over time, quietly undermining both reliability and trust.
Early Warning Signs of Manufacturing Downtime You Should Not Ignore
Frequent Unexplained Stalls on the Line
In many facilities, production pauses occur without any obvious cause. Operators quickly reset equipment, the line starts again, and the event is forgotten. These micro stops often appear minor, but when tallied over days and weeks they accumulate into hours of lost production. What makes them particularly dangerous is that they usually go unrecorded or misattributed. If your downtime tracking system shows a large percentage of events labeled as “unknown,” that is a red flag. It means your plant is losing valuable visibility. Research on downtime has shown how large the hidden total is. Siemens’ True Cost of Downtime 2024 survey estimates that unplanned downtime costs the world’s 500 largest companies about 11 percent of their revenue, and that an average large plant still loses 27 hours a month to it. When unexplained stalls become routine, they should be treated as signals that the facility is not only losing output but also missing the opportunity to identify deeper reliability issues.
Operators Pressing Stop Buttons More Often Than Expected
Operator-initiated stops are among the hardest to classify because they are often necessary. An operator who observes a misaligned product, a quality concern, or a potential safety risk will stop the line. This is the right behavior in the moment, but frequent reliance on stop buttons reveals instability in the process. If operators feel compelled to intervene multiple times in a shift, the root cause is usually a recurring equipment or process issue that has not been addressed. These interruptions may not always appear in the downtime logs because they are seen as quick pauses rather than failures. Over time, however, they represent a measurable loss in output and can indicate that systems are not optimized for stable operation. Frequent operator stops should be viewed as early signs of systemic weakness, not simply isolated events.
Sluggish or Frozen HMIs and Displays
Another warning sign often overlooked is the performance of HMIs and operator terminals. A screen that freezes, responds slowly, or requires frequent reboots is more than an inconvenience. It is a visible symptom of obsolescence. Many HMIs in use today run on outdated operating systems that vendors no longer support. When those systems fail, recovery can take days because compatible software and licenses are no longer available. Teams resort to pulling old laptops out of storage or searching online for discontinued drivers. These delays are a reminder that every aging HMI is a potential point of failure that can extend downtime far beyond what would be expected in a modern environment. If your facility has HMIs that operators regularly complain about, it is not just a usability issue, it is an operational risk waiting to escalate.
Mismatched Firmware and Hardware Versions
One of the subtler but equally damaging issues I have encountered is the mismatch between firmware versions across modules or controllers. A seemingly straightforward swap of a faulty module can become a prolonged outage when the new hardware does not communicate properly with the rest of the system. Without proper version control and up-to-date backups, engineers spend hours troubleshooting what should have been a routine replacement. This is a warning sign that the plant lacks a standardized approach to system updates and documentation. If your team cannot say with confidence what firmware versions are running on your critical assets, you are vulnerable to extended downtime. Version mismatches are not rare edge cases, they are predictable consequences of poor lifecycle management.
Network Glitches That Defy Easy Diagnosis
Perhaps the most frustrating warning signs come from the network. A line that randomly goes down and comes back up without explanation often points to failing network switches, degraded cabling, or poor segmentation. These issues are notoriously difficult to diagnose because they appear intermittently and may affect multiple areas of the plant at once. Networks are the silent backbone of modern manufacturing, yet they often receive little attention until they fail. The same Siemens survey found that, across the sectors it covers, the cost of an hour of downtime roughly doubled between 2019 and 2023, which makes every intermittent fault more expensive than it used to be. Aging and unmonitored network infrastructure is now one of the leading contributors to extended outages. If your plant experiences “ghost faults” that vanish as quickly as they appear, it is likely a sign of deeper network health problems.
Why Paying Attention to Warning Signs Matters
It is tempting to ignore these issues because production often resumes quickly and leadership does not see the immediate financial hit. Yet each of these small signals is an early indicator of larger risks. When they are dismissed, they accumulate into significant downtime that directly impacts profit and loss. Siemens puts the cost of an hour of downtime in a large plant at about $36,000 in fast-moving consumer goods and about $2.3 million in automotive, as of its 2024 report, and estimates that even smaller manufacturers can face costs of up to $150,000 an hour. The implication is clear. Plants that treat early warning signs as minor annoyances are leaving themselves vulnerable to catastrophic events. On the other hand, facilities that capture and act on these signals not only reduce downtime but also extend asset life and build resilience into their operations.
Early warning signs are not noise. They are valuable signals that, when taken seriously, help leaders prevent the most costly failures before they occur.
What Manufacturing Downtime Costs Beyond the Obvious
When I walk through a facility and have conversations with leadership, I often hear quick estimates of what downtime costs. Someone will usually say that the line makes a certain number of cases per hour, each case is worth a certain amount, and that is the figure they use to calculate the impact. On paper, that number is correct, and I have seen it used countless times to justify capital projects or maintenance budgets. But in reality, the true cost of downtime goes much further than lost production.
The first layer of hidden cost is labor. People still need to be paid even when the line is down, and the cost of overtime often creeps in as facilities scramble to make up for lost output. The second is material waste. If the stop occurs mid cycle, entire batches of raw ingredients can be scrapped, which is particularly painful in food, beverage, and chemical plants. I have seen cases where a downtime event forced an entire shift of material to be discarded. The third is logistics. Once a schedule is disrupted, the ripple effect on warehousing, trucking, and customer commitments becomes very real. Expedited shipping, rescheduling fees, and strained relationships with distributors often follow.
Then there is the impact that never appears neatly in a spreadsheet. Customers lose confidence in suppliers who miss deadlines. Insurance premiums can rise if systems are identified as obsolete or unsupported. Regulatory scrutiny increases when control systems are not properly documented or maintained. These are costs that erode the reputation of a plant and eventually make their way into the profit and loss statement in ways that leadership sometimes struggles to connect back to downtime.
When you consider all of these factors together, the math looks very different. It is no longer about a single line producing thirty thousand dollars per hour in revenue. It becomes about the compounded effect across people, materials, logistics, customer trust, and compliance. That is the real cost of downtime, and it is why facilities that take obsolescence seriously tend to outperform those that ignore it.
A practical way to make the hidden layers visible is to cost one real event, layer by layer, using your own figures.
| Cost layer | What to count | Where the number comes from |
|---|---|---|
| Lost contribution | Units not made multiplied by margin, or by revenue if the volume cannot be made up | Production schedule and finance |
| Labor | Wages paid during the stop, plus overtime to recover | Payroll and shift records |
| Material | Batches, ingredients or packaging scrapped because of the stop | Scrap and inventory records |
| Logistics and penalties | Expedited freight, rescheduling fees, missed-delivery penalties | Shipping and customer contracts |
| Recovery | Emergency parts, premium shipping, outside technicians | Purchasing and invoices |
| Customer and compliance | Lost orders, audit findings, insurance conditions | Sales, quality and risk management |
Strategies to Reduce Unplanned Manufacturing Downtime
The causes above point to a short list of strategies. None of them is new, and each one works best when the plant can see its own downtime clearly first.
| Strategy | What it addresses | First practical step |
|---|---|---|
| Accurate stop capture | Unknown and misattributed stops | Give every stop a reason code, and record blocked and starved states separately from the cause |
| Bottleneck and buffer management | Short stops that cascade into line outages | Identify the true bottleneck and protect it with buffers upstream and downstream |
| Preventive and predictive maintenance | Breakdowns that could have been seen coming | Move the most critical assets off run-to-failure first |
| Spares strategy | Long waits for parts | Stock the critical spares for obsolete and long-lead items |
| Backups and version control | Long recoveries after a controller or HMI fails | Keep a current, tested backup of every PLC and HMI |
| Obsolescence management | Failures with no replacement path | Map lifecycle status for every controller, HMI and drive |
| Network health | Intermittent “ghost” faults | Replace unmanaged switches that carry line traffic and monitor the rest |
The maintenance row has the strongest evidence behind it. NIST’s study of U.S. manufacturing maintenance found that establishments in the top quarter for reliance on reactive maintenance had 3.3 times more downtime than those in the bottom quarter, and that heavy users of predictive maintenance had 15 percent less downtime than plants relying mainly on preventive maintenance. Our OEE and downtime improvement work starts with the first row of the table, because every other row depends on knowing where the time goes.
Taking Action Before It Is Too Late
I have always believed that the best plants are the ones that stay ahead of their problems rather than reacting to them. When I see unexplained stops, sluggish HMIs, mismatched firmware, or aging network gear, I treat them as signals, not as isolated headaches. Those signals are telling us that the plant is vulnerable to a much larger event. If we wait until the catastrophic failure happens, the cost is almost always measured in days of downtime and millions of dollars.
On the other hand, I have also seen the opposite outcome. Facilities that invested in documenting their systems, keeping backups current, managing obsolescence, and planning for modernization not only reduced downtime but also built confidence across the organization. Engineers trusted that they could recover quickly. Operators trusted that the equipment would run as expected. Leadership trusted that capital investments were being managed responsibly.
Frequently Asked Questions About Manufacturing Downtime
What is manufacturing downtime?
Manufacturing downtime is any period when a machine, line, process or plant is not producing when it is scheduled to. Planned downtime covers scheduled maintenance, changeovers and sanitation. Unplanned downtime covers breakdowns, operator stops, sensor trips, material shortages and network faults. Unplanned downtime is the costly kind, because it cannot be scheduled around and often stops machines that have nothing wrong with them.
What are the most common causes of downtime in manufacturing?
The most common causes are operator-initiated stops, sensors and interlocks tripping on quality, equipment or safety limits, mechanical and electrical failures, material starvation or blockage between machines, changeovers that overrun, and control system faults such as failed HMIs, firmware mismatches and network problems. In many plants a large share is recorded as unknown, which is itself the first problem to fix.
How do you calculate the cost of downtime?
Start with lost contribution: units per hour multiplied by margin, or revenue if the lost volume cannot be made up later. Then add the hidden layers: labor paid while idle and overtime to recover, scrapped material, expedited freight and penalties, and the cost of emergency parts and outside help. For a recurring stop, multiply by its frequency. The total is usually well above the revenue figure quoted in meetings.
What is the difference between planned and unplanned downtime?
Planned downtime is scheduled in advance: preventive maintenance, changeovers, cleaning and upgrades. The plant chooses when it happens and prepares for it. Unplanned downtime is unexpected: breakdowns, trips, quality stops and shortages. It arrives at the worst moment, without parts or people ready, and spreads through the line through blocked and starved machines. Reducing downtime mostly means converting unplanned events into planned ones.
How can manufacturers reduce unplanned downtime?
Capture every stop with a real reason code, including blocked and starved states, so the true causes are visible. Then attack the largest causes: shift maintenance from reactive toward preventive and predictive, size buffers around the bottleneck, keep critical spares and current backups, manage obsolete controllers and HMIs before they fail, and monitor network health. Measure the result with availability and OEE, line by line.
Downtime Can Be Reduced, Contained and Managed
Downtime will never be eliminated entirely, but it can be reduced, contained, and managed. The difference lies in whether you see early warning signs for what they are and whether you treat obsolescence as a liability that needs to be addressed proactively. Our guide to control system modernization covers the second half of that, and a manufacturing execution system is usually where the first half, capturing every stop, ends up living.
References and further reading
- The True Cost of Downtime 2024 · Siemens (Senseye Predictive Maintenance)Survey-based estimates of downtime cost per hour by sector and of downtime hours per large plant, 2019 to 2023.
- Economics of Manufacturing Machinery Maintenance: A Survey and Analysis of U.S. Costs and Benefits (NIST AMS 100-34) · National Institute of Standards and TechnologyCompares downtime and defects at plants relying on reactive, preventive and predictive maintenance.
- Manufacturing Machinery Maintenance · National Institute of Standards and TechnologySummary of the NIST maintenance research program and its headline figures.