
Insights
OEE in Food and Beverage Manufacturing: From the Machine to the Management Meeting
OEE in food and beverage plants: what it measures, why line OEE hides the machine that stopped, how data leaves the PLC, and which systems calculate it.
Table of contents
Most food and beverage plants have an OEE number. It’s on a screen in the production office, in the morning meeting deck, and sometimes in someone’s bonus plan. What most plants don’t have is agreement on what that number means, where it was measured, or which machine it’s blaming. The line shows 61% and everyone in the room has a different explanation for the other 39.
Joltek’s position on OEE in food and beverage manufacturing is simple. OEE is the right place to start understanding how a plant runs, and a poor place to stop. It works when three things are true: it’s reported honestly, it’s measured per machine and not only per line, and it’s tied to the fault codes the machines already produce. Without those, it’s a number for a meeting. With them, it tells maintenance what to fix on Tuesday.
This guide follows OEE data from the machine to the management meeting:
- what OEE measures, using the definitions in ISO 22400
- what a “good” score is, and why there’s no honest single answer for food plants
- a worked bottling line example, where line OEE blames the filler for a labeler problem
- what each machine’s PLC already knows, and the four ways that data gets out
- a vendor-neutral map of the systems that calculate OEE, sorted by where they get their data
- who should use the number, and for what
It’s written from work collecting OEE and production KPIs in dozens of plants, from a single case counter at the end of a line to extracting data directly from every machine’s controller.
What is OEE in food and beverage manufacturing, and how is it calculated?
OEE, overall equipment effectiveness, is the share of planned production time in which a line or machine makes good product at its rated speed. It’s the product of three ratios: availability (was it running?), performance (was it running at rated speed?) and quality (was the product good?). An OEE of 60% means 40% of the planned time was lost to stops, slow running or rejects.
The formulas, as OEE.com sets them out, are:
- Availability = run time / planned production time
- Performance = (ideal cycle time × total count) / run time
- Quality = good count / total count
- OEE = availability × performance × quality
A worked example makes the arithmetic concrete. A filler rated at 18,000 bottles per hour can make 300 bottles a minute. On a 480-minute shift it stops for 60 minutes, so it runs for 420: availability is 420 / 480, or 87.5%. In those 420 minutes it could have made 126,000 bottles and made 105,000: performance is 83.3%. Of the 105,000, 103,000 were good: quality is 98.1%. OEE is 0.875 × 0.833 × 0.981, or 71.5%.
The ISO 22400 definitions
The international definition sits in ISO 22400-2, the standard for manufacturing operations KPIs, first published in 2014 and amended in 2017, with a second edition in development. It uses slightly different names and a more careful time model.
| ISO 22400-2 term | What it means | Common name |
|---|---|---|
| Planned operation time (POT) | The time the work unit is planned to be available | Shift or calendar time, scheduled |
| Planned downtime | Planned time it will not run, such as scheduled maintenance | Planned stops (some of them) |
| Planned busy time (PBT) | Planned operation time minus planned downtime | Planned production time |
| Actual production time (APT) | Time actually spent producing; value-adding time only | Run time |
| Availability = APT / PBT | Availability | |
| Effectiveness = planned run time per unit × produced quantity / APT | Performance | |
| Quality ratio = good quantity / produced quantity | Quality |
ISO calls the result the OEE index. Two details in the time model matter for food plants. Setup time and unplanned interruptions both sit inside planned busy time, so under ISO 22400 a changeover is an availability loss, not planned downtime. Vorne’s widely used model treats changeovers the same way, as planned stops inside planned production time.
That’s where food and beverage OEE gets contentious. CIP cycles, sanitation shifts, allergen changeovers and flavour changes take a meaningful share of a food plant’s week, and each plant decides which of them count as “planned”. Take a four-hour sanitation out of planned time and availability jumps; leave it in and the same line looks much worse. Neither choice is wrong. Changing the choice between lines, or between months, is.
The six big losses, in food and beverage terms
Seiichi Nakajima’s six big losses, from his 1988 book on total productive maintenance, are still the standard way to sort where OEE goes. Each maps to one of the three ratios.
| Loss | Ratio it reduces | Food and beverage example |
|---|---|---|
| Equipment failure | Availability | Capper cap chute jam |
| Setup and adjustment | Availability | Flavour or allergen changeover, CIP between products |
| Idling and minor stoppages | Performance | Labeler stopping for a few seconds at a time on registration |
| Reduced speed | Performance | Filler held below rated speed because a downstream machine can’t keep up |
| Process defects | Quality | Underweight fills rejected at the checkweigher |
| Reduced yield | Quality | Startup rejects after a CIP or a product change |
OEE is one KPI in a wider system. For how it fits next to scheduling, quality and traceability, see how OEE fits into a wider MES strategy.
What is a good OEE score for a food and beverage plant?
There isn’t a reliable industry benchmark for food and beverage OEE. The 85% figure that circulates as the target comes from Seiichi Nakajima’s 1988 book on total productive maintenance, where he described 90% availability, 95% performance and 99% quality as ideal conditions. The food figures published since come from vendor customer data and self-reported surveys. The useful comparison is the plant against its own trend, measured the same way every week.
Nakajima’s figures are often quoted as a benchmark. In the book they’re something narrower: “ideal conditions” drawn from his experience with Japanese prize-winning plants, and 0.90 × 0.95 × 0.99 comes to just over 85%. They were never a food industry average.
The food and beverage numbers that do exist need their sources attached:
- Evocon, an OEE software vendor, reports an average OEE of 53% for food and beverage customers, with 4% of plants at 85% or above, from its customer data between May 2023 and June 2024. It doesn’t publish a sample size.
- Food Engineering’s 2016 reader survey had processors reporting 68% OEE on average against a 74% target. The figures are self-reported.
- No association-level benchmark turned up in the research for this guide. PMMI, LNS Research, ARC, Aberdeen and McKinsey were all checked.
The gap between 53% and 68% says less about the industry than about how differently plants measure. That’s the practical point. A plant at 45% that measures honestly, per machine, is in a better position than a plant reporting 80% that nobody on the floor believes. The first has a baseline. The second has a number.
Why isn’t line OEE enough? A bottling line example
Line OEE is usually measured at the constraint, which on a bottling line is the filler. When a machine downstream slows down or faults, the filler backs up and stops, and the filler’s OEE takes the loss. So line OEE tells you how much time the line lost. Only machine-level states and fault codes tell you which machine caused it.
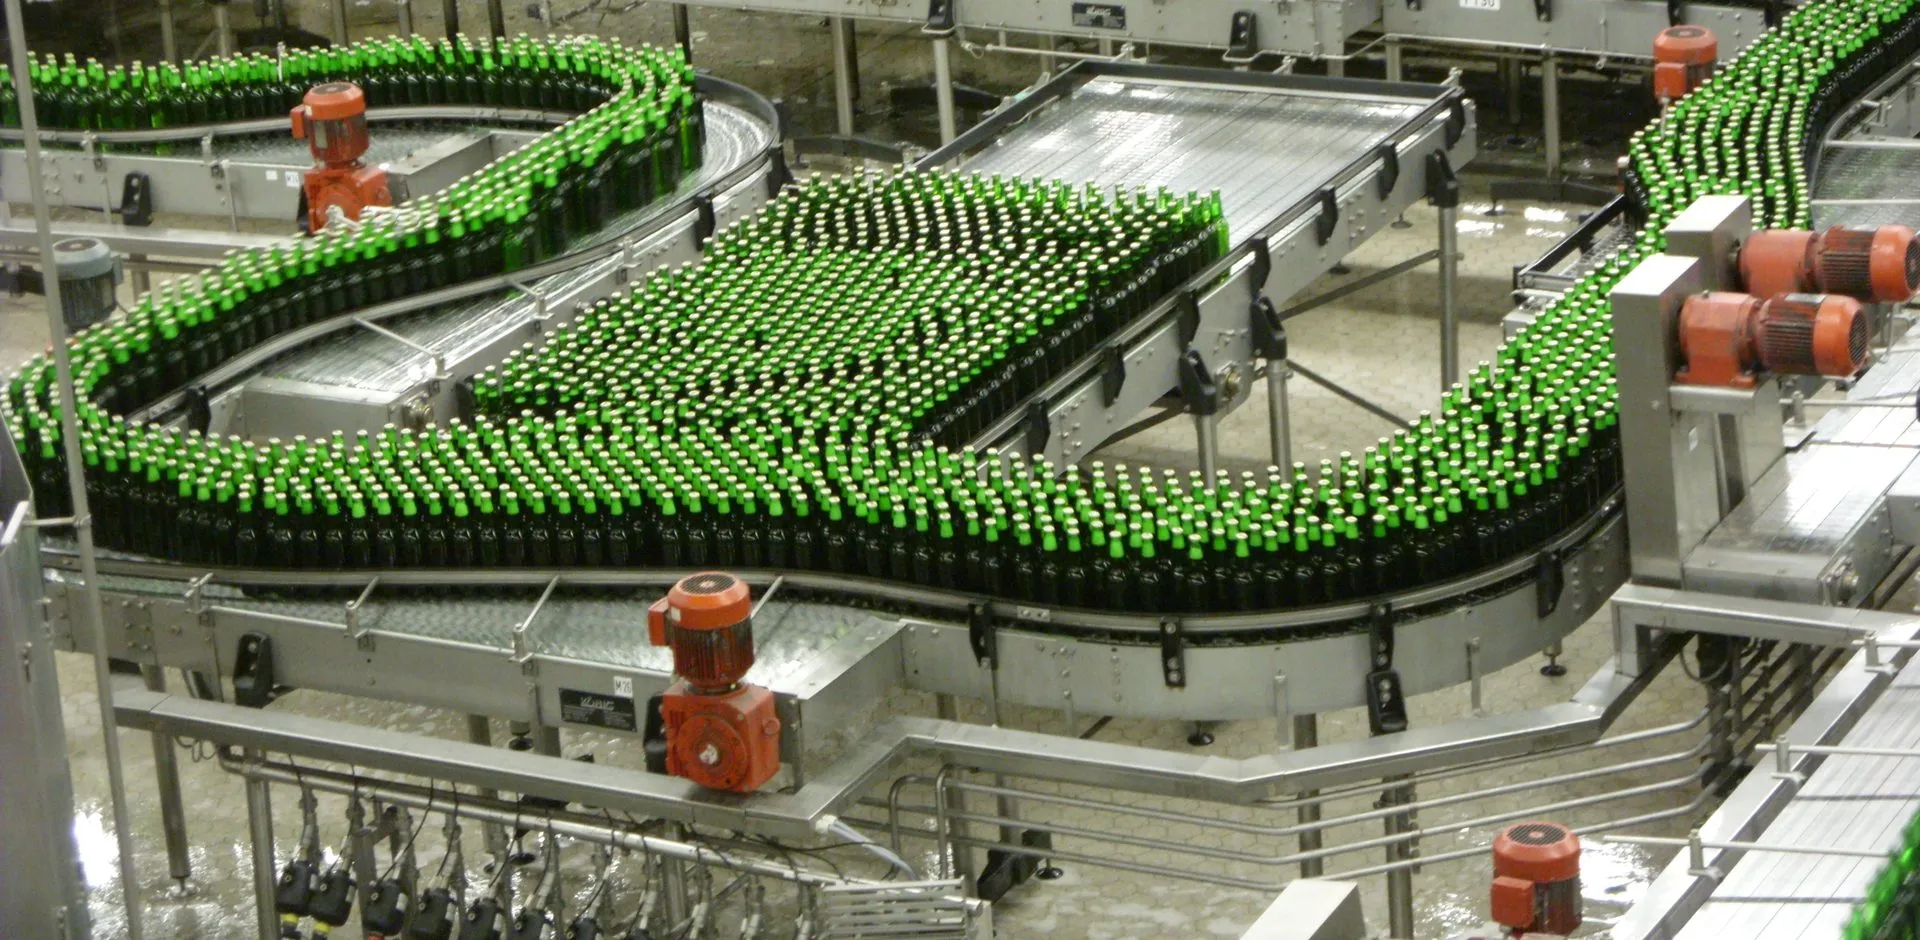
A bottling line is built around the filler. It’s usually the most expensive machine on the line, the hardest to restart cleanly, and the one where product is exposed. So the line is designed to keep it running. Every machine downstream of it runs faster than it does, and the conveyors between machines hold a buffer of product. That speed profile is called the V-curve: the filler sits at the bottom of the V at 100% of line speed, and the machines on either side run progressively faster, often 110 to 130% of filler speed, so they can catch up after a short stop without starving or blocking the filler.
Because the filler sets the output, it’s where most plants measure line OEE. That’s a sound choice for counting bottles. It’s a poor choice for explaining stops, because a filler that’s blocked by a full outfeed conveyor stops in the same way as a filler with its own fault. Measured at the filler, every downstream problem looks like filler downtime.
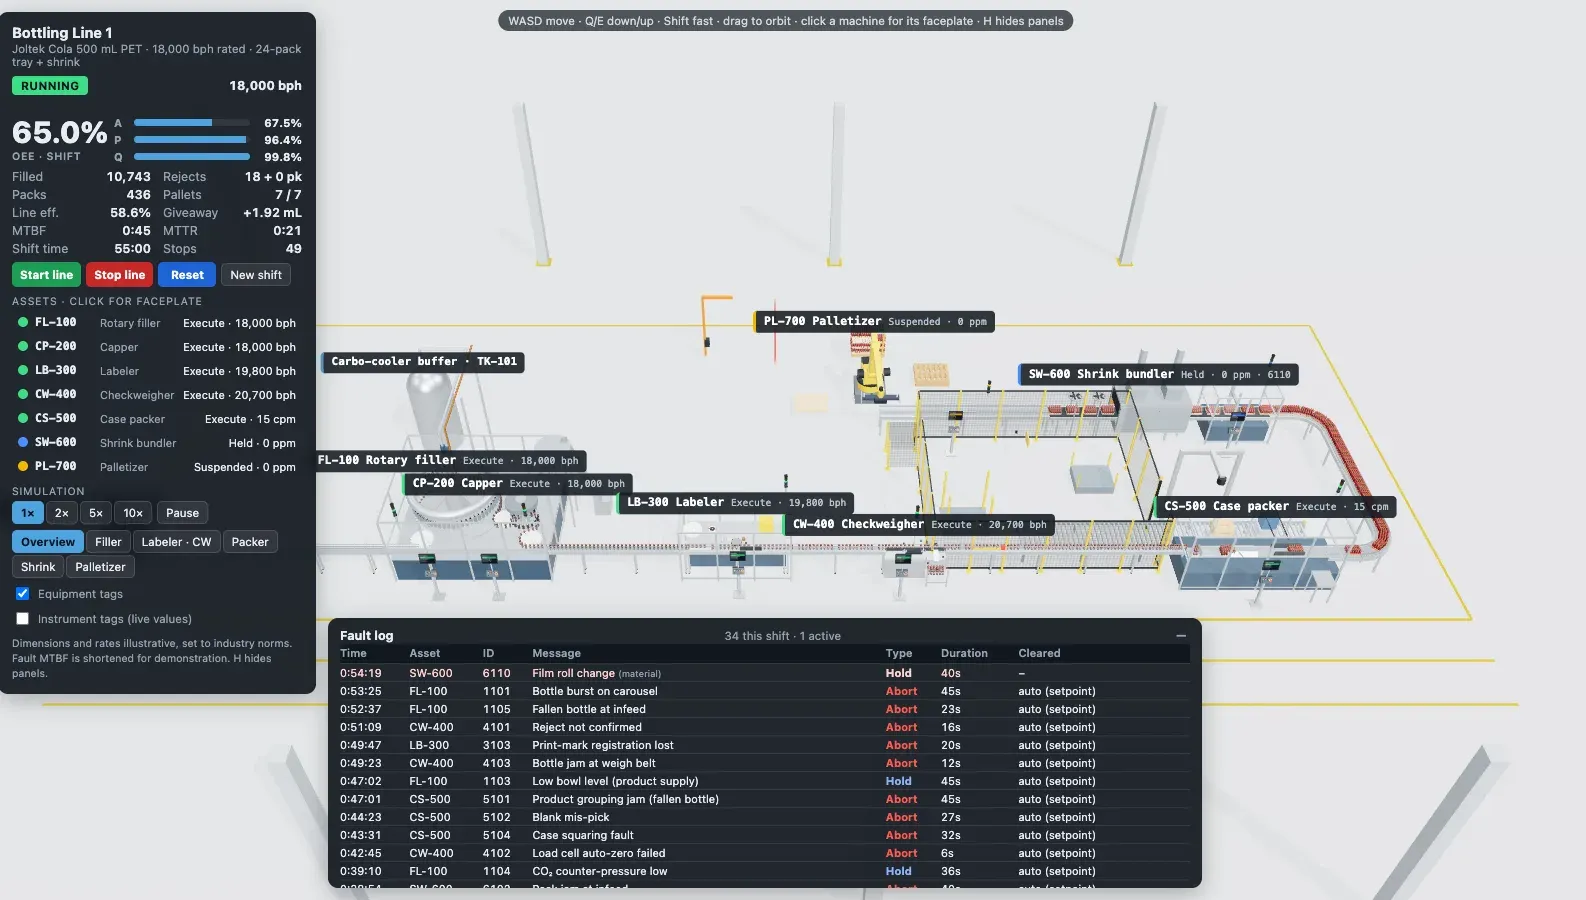
To show what that hides, Joltek ran a four-hour shift on a simulated bottling line built for its downtime investigation work. This is a simulation, not a plant. It has seven machines (filler, capper, labeler, checkweigher, case packer, shrink bundler and palletizer), PackML machine states, a fault log, and OEE measured at a filler rated at 18,000 bottles per hour. Because it’s simulated, the answer key is known: for every second the filler wasn’t running, the simulator records which machine truly caused it, following the chain of blocked and starved machines back to the source.
The shift’s line OEE was 60.4%: availability 70.0%, performance 90.5%, quality 95.3%. The filler wasn’t producing for about 72 minutes of the four hours. Here’s where those minutes came from, next to how many minutes of faults each machine logged on its own controller.
| Machine | Its own fault time (from its PLC) | Filler minutes it actually caused |
|---|---|---|
| Labeler | 20.3 min | 23.4 min |
| Case packer | 23.7 min | 18.2 min |
| Filler (its own faults) | 9.9 min | 11.4 min |
| Capper | 8.0 min | 8.7 min |
| Checkweigher | 4.3 min | 5.5 min |
| Shrink bundler | 20.6 min | 4.6 min |
| Palletizer | 7.7 min | 0 min |
| Total | about 72 min |
Three things in that table matter for any plant.
First, line OEE alone shows none of it. It says availability was 70%. It doesn’t say that more than four-fifths of the lost time came from machines other than the filler.
Second, a machine’s own fault total is a poor guide to what it cost the line. The shrink bundler logged 20.6 minutes of faults and cost the filler 4.6 of them, because the conveyor in front of it absorbed most of its short stops. The labeler logged slightly less fault time than the case packer, yet cost the filler more, because it sits close to the filler with little buffer between them. A maintenance team ranking machines by fault minutes would have gone to the case packer and the shrink bundler first. The labeler was the bigger problem.
Third, averages hid the cause even from a careful investigator. Over the shift, the labeler was blocked by the machines downstream of it a large share of the time, so on shift-wide percentages it looked like a victim of the case packer. Followed one stop at a time, its own faults were the largest single source of lost filler time. The only way to see that is to have each machine’s state and fault code with a timestamp, and to walk the stops in order.
The same shift also shows how a performance loss can hide behind a healthy-looking availability. For 50 minutes, someone had turned the labeler down from 19,800 to 12,000 bottles per hour, below the filler’s rate. The labeler became the constraint. The filler kept running, just slower. In those half-hours filler performance fell as low as 69% while its availability went up, because the filler wasn’t stopping anymore. On an availability-only dashboard, that period looks like an improvement.
The filler gets the downtime. It rarely owns the cause. Line OEE is the right number for the meeting about output. It’s the wrong number for the meeting about what maintenance should fix this week, and that second meeting is where OEE pays for itself.
What does each machine’s PLC already know?
Almost every machine on a modern food or beverage line already has a PLC that knows the machine’s state (running, stopped, blocked, starved or faulted), its fault codes, its counts and its speed. Many OEE projects start by adding a sensor to measure something the machine’s controller already knows. The first question is what is already there.
The table below shows what a packaging line’s controllers typically hold. The exact tags vary by OEM and by the age of the machine, but the categories are consistent.
| Machine | State | Typical fault or stop reasons | Counts | What OEE uses it for |
|---|---|---|---|---|
| Depalletizer | Running, faulted, starved of pallets | Layer misfeed, sweep fault, pallet jam | Layers, pallets | Upstream starvation of the filler |
| Filler | Full machine state; often the richest controller on the line | Bottle burst, infeed starwheel jam, low product level | Bottles filled, fill-level rejects | The constraint: line OEE, ideal rate |
| Capper | Running, faulted, blocked | Cap chute jam, missing cap, torque fault | Bottles capped, cap rejects | Availability losses next to the filler |
| Labeler | Running, faulted, blocked, starved | Label web break, roll change, registration lost | Bottles labelled | Short stops close to the filler |
| Checkweigher or inspection | Running, faulted | Reject by reason (underweight, overweight, no cap, no label) | Total and rejects by reason | Quality, by cause |
| Case packer | Running, faulted, blocked, starved | Blank mis-pick, magazine empty, grouping jam, hot-melt fault | Cases | Downstream blocking |
| Shrink bundler or wrapper | Running, faulted, blocked | Film break, knife fault, roll change | Packs, pack rejects | Downstream blocking, quality |
| Palletizer and stretch wrapper | Running, faulted, starved | Vacuum pick failure, layer fault, film break | Pallets | End-of-line blocking |
Process assets hold just as much, in a different shape:
- Mixers, kettles and batch systems know their phase and step, often structured to ISA-88, and the time spent in each.
- Ovens, fryers and cooling tunnels know belt speed, zone temperatures and alarms. Running below the set belt speed is a performance loss.
- Pasteurisers know pasteurisation units and divert events. A divert is a quality loss with a precise timestamp.
- CIP skids know which circuit they’re cleaning, which step they’re on, and whether the cycle completed. That’s the cleanest source for sanitation time in the whole plant.
Batch and continuous process OEE needs its own time basis and its own definitions, and it fails in its own ways.
The common vocabulary for machine states is PackML, published by ISA as ISA-TR88.00.02, with the current edition from 2022. It defines a standard state model (Idle, Execute, Held, Suspended, Aborted and the rest), operating modes, and a set of standard tags called PackTags, including a stop reason and product counts. A machine that exposes PackML tells an OEE system “held, reason 3101” instead of a vendor-specific bit that someone has to decode. The simulated line above uses PackML states for exactly that reason.
What “already knows” means depends on the machine. A 25-year-old case packer may expose only running, faulted and a count, and its fault words may live in internal memory nobody mapped. A new filler from a major OEM may expose a full PackML interface. The gap between those two is the subject of the next section, and it’s usually where the real cost of an OEE project sits. For the wider picture of what downtime costs a plant, see the causes and real cost of unplanned downtime.
How does OEE data get from the PLC to a dashboard?
There are four routes. A sensor at the end of the line counts cases while operators type in the downtime reasons. A driver reads tags straight from each machine’s PLC. A standard machine interface, PackML or the Weihenstephan Standards over OPC UA, delivers states, stop reasons and counts in an agreed shape. Or the machines publish to a broker over MQTT. Only the last three bring the machines’ fault codes with the counts.
| Route | What it gives | What it needs | Where it usually fails |
|---|---|---|---|
| 1. End-of-line sensor plus manual reasons | A line count and typed downtime reasons | One sensor, a tablet, operator time | No machine states, no fault codes; reasons are late and rounded |
| 2. Driver reads from each PLC | State, fault and count tags from every machine | Network access to each PLC, tag mapping | Unmapped fault words, polling too slow for short stops |
| 3. Standard interface (PackML, Weihenstephan) | Standard states, stop reasons and counts | The interface in the machine spec; OPC UA on the machine | Older machines without it; OEM implementations that vary |
| 4. MQTT publish | States, faults and counts as events, to any subscriber | An edge gateway or a machine that can publish; a broker | Topic and payload design nobody owns |
Route 1: the sensor at the end of the line
Joltek’s founder considers this the worst pattern in the dozens of plants Joltek has worked in. A single proximity switch at the end of the line counts cases. Operators get a tablet or a terminal to enter the reason when the line stops. It’s quick to install, and it produces a line count and a list of reasons.
It doesn’t produce machine states or fault codes, so it can’t do the analysis in the bottling line example. When the case count stops, it can’t tell a labeler web break from a case packer jam. The reason has to come from an operator, who is usually busy restarting the line, and who enters it late, rounds it, or picks whatever is first on the list. The machines’ PLCs knew the answer the whole time. Nobody connected to them.
Route 2: reading tags from each PLC
An OPC server or a SCADA platform’s drivers, such as Kepware or Ignition’s built-in drivers, read the state, fault and count tags from each machine’s controller. It works with almost any PLC the driver supports, which makes it the most common route on mixed-vendor lines. The quality of the result depends on two things: whether someone maps the right fault words, and whether the polling rate is fast enough to catch the short stops that matter. For that second point, see how polling rates and PLC scan cycles shape the data you collect.
Route 3: standard machine interfaces
Two standards cover most food and beverage packaging. PackML (ISA-TR88.00.02-2022) defines the state model and PackTags, and the OPC Foundation publishes it over OPC UA as OPC 30050. The Weihenstephan Standards, managed from the Technical University of Munich’s chair of brewing and beverage technology, cover filling and packaging (WS Pack), food processing (WS Food), bakery (WS Bake) and brewing (WS Brew). They were published as the OPC UA companion specification OPC 40600 in 2021. The two groups agreed in 2007 to collaborate on harmonising their standards, and the OPC UA version of Weihenstephan builds on the PackML specification.
The catch is that neither standard arrives by default. It has to be written into the machine purchase specification, tested at the factory acceptance test, and kept when the OEM updates the code. A plant that specifies PackML or WS Pack on every new machine gets consistent OEE data for the life of the line. A plant that doesn’t gets whatever each OEM decided.
Route 4: publishing over MQTT
Machines, or an edge gateway in front of them, publish state changes, faults and counts to an MQTT broker, and any system that needs them subscribes. Sparkplug 3.0, published as the international standard ISO/IEC 20237 in 2023, defines the payload and the session rules. The advantage is that each stop arrives as an event with its own timestamp, which is exactly what the bottling line analysis needs. For the protocol itself, see MQTT for manufacturing data.
Reason codes: let the PLC answer first
The best reason code is the one the machine already knows. A practical design takes the PLC’s fault code when there is one and asks the operator only when there isn’t, such as for a material shortage or a missing operator. Infor documents exactly this in its MES: reasons known to the PLC are captured automatically, and the operator explains the rest from the dashboard. It cuts operator entry to the stops the machine genuinely can’t explain.
What usually has to be fixed first
Joltek’s founder considers the best approach to be tying into data the machines already have. It’s also the route that most often hits a wall before the first dashboard. The usual obstacles are:
- machines with no network connection at all, or connected only to an OEM’s local panel
- flat or unmanaged networks that can’t safely carry another system’s traffic
- PLCs too old to take a communications card, or with no spare connections
- OEM programs that never exposed their fault words, or protected them
These are plant infrastructure problems, not OEE problems, and they’re worth fixing for reasons beyond OEE.
Which systems can calculate OEE? A vendor-neutral map
OEE products fall into five groups, defined by where they get their data: bolt-on counters, frontline and connected-workforce platforms, monitoring from the line builder, OEE modules inside an MES, and builds on a historian or unified namespace. The right group depends on whether the plant can read its machines’ PLCs today, not on the brand.
| Group | Examples | Where the data comes from | Fault-code depth | What it needs from the plant |
|---|---|---|---|---|
| Bolt-on counters | Vorne XL, Evocon, Worximity | A sensor or a signal wired to a device | Low unless fed from the PLC | Little: a sensor and a network drop |
| Frontline and connected workforce | Redzone | Line counts plus operator input on tablets | Depends on the integration | Operator time, a team-based routine |
| Line-builder monitoring | KHS Innoline, Krones Line Diagnostics, Sidel Efficiency Improvement Tool | The OEM’s machines, often through Weihenstephan | High on that OEM’s machines | A line from that builder, or one integrated to its standard |
| MES OEE modules | Sepasoft OEE Downtime (Ignition), Siemens Opcenter Execution Foundation OEE, AVEVA MES, Plex Production Monitoring, Parsec TrakSYS | PLC tags through drivers, OPC UA or MQTT | High, if the tags are mapped | Routes 2 to 4 above, plus MES configuration |
| Historian or UNS build | A historian or broker plus a calculation layer, such as FlowFuse’s Node-RED OEE blueprint | Whatever the historian or namespace already collects | As deep as the data | An existing data layer and someone to own the logic |
A few notes on each group, from the vendors’ own material as of October 2026:
- Bolt-on counters are the fastest start. Vorne describes XL as a stand-alone device wired to one or two existing sensor inputs, such as a photo-eye or a proximity switch, and states it has more than 45,000 installations. Evocon pairs a line sensor with an IIoT device and cloud software, with operators tagging stop reasons. Worximity sells its Tileboard and Tile+ products with food and beverage processing as a named market. All of them can show line OEE within days. Fault-code depth depends on whether they’re fed from the machines’ controllers.
- Frontline platforms such as Redzone, a QAD company, combine production tracking with team routines and operator engagement. They’re as much a way of running the shift as a measurement system.
- Line builders increasingly ship their own monitoring. KHS states that Innoline MES evaluates line data to the Weihenstephan standard. Krones’ Line Diagnostics determines OEE across its lines. Sidel says its Efficiency Improvement Tool works on Sidel and non-Sidel equipment.
- MES modules calculate OEE as part of a wider production system. Sepasoft’s OEE Downtime module runs on Ignition and combines OEE calculation with downtime tracking. Siemens offers Opcenter Execution Foundation OEE, plus SIMATIC Performance Insight as an Industrial Edge app for machine KPIs. AVEVA lists AVEVA MES and AVEVA Production Management for OEE. Rockwell’s OEE path is Plex: FactoryTalk Metrics will be discontinued after September 2028, with Plex MES as Rockwell’s recommended replacement, and Plex Production Monitoring shows OEE. FactoryTalk View and FactoryTalk Optix are HMI platforms, not OEE engines. Parsec’s TrakSYS is widely used in food and beverage.
- Builds on a historian or namespace suit plants that already collect machine data and have someone to own the calculation. They’re the most flexible and the easiest to get subtly wrong. For the data layer underneath, see what a data historian does and does not do.
The grouping matters more than the brand. A bolt-on counter is a sensible first step on a line where nobody can read the PLCs yet, and it will show line OEE quickly. It won’t show the labeler problem from the bottling line example unless it’s connected to the labeler. An MES module or a build can show it, but only after the plant has done the work in the previous section. Choose the group that matches what the machines can deliver today, and plan the path to the next one.
How do plants end up with an OEE number nobody believes?
Usually by moving the denominators. Lower the rated speed, leave losses out of the planned time, or count rework as good product, and OEE goes up without the line changing at all. Christoph Roser of AllAboutLean names these three as the main levers. Joltek’s founder has seen OEE numbers adjusted in exactly these ways in plants Joltek has worked in.
Roser’s article on how plants fudge OEE quantifies the time-basis lever. Excluding planned maintenance from the time basis adds about 5% to OEE. Excluding breaks adds about 10%. Lowering the speed basis to a “realistic” rate instead of the rated one lifts performance, and reclassifying breakdowns as planned stops lifts availability. His estimate is that true OEE in Western plants is typically 40 to 60%, well below many reported figures.
Configuration can do the same thing quietly. AVEVA’s MES, for example, classifies each event as runtime, downtime or neither, and events classed as neither drop out of the availability calculation. That’s a reasonable feature. It also means one dropdown decides whether a sanitation shift counts. Every OEE system has a version of that choice, and it’s usually made once by an integrator and never revisited.
Incentives make all of this worse. When a bonus is tied to OEE, every one of those levers gets pulled, and nobody has to falsify anything to do it. The fix is a written definition, owned by someone outside the line’s own reporting, and applied the same way everywhere.
Who uses OEE, and what should each role do with it?
Plant management uses OEE to see the trend and the capacity it can promise. Continuous improvement uses it to choose the next loss to attack. Operations uses it shift by shift. Maintenance needs the machine-level states and fault codes underneath it. One number can serve all four, but only if it can be drilled down to the machine and the fault.
| Role | The question they ask | Level they need | How often | What they need under the number |
|---|---|---|---|---|
| Plant manager, director | Are we getting better? How much capacity can we commit? | Plant and line | Weekly, monthly | A trend measured the same way over time |
| Continuous improvement | Which loss do we attack next? | Line and machine | Weekly | Losses ranked by minutes, by machine and by cause |
| Operations, shift leads | What happened on my shift, and what’s stopping us now? | Line and machine | Per shift, live | Current state, top stops this shift |
| Maintenance, engineering | Which machine and which fault, how often, and is it getting worse? | Machine and fault code | Daily, weekly | Fault codes with counts, durations and timestamps |
The distinction that matters is between OEE as a starting point and OEE as the answer. A plant-level OEE tells management whether things are moving. It tells nobody what to do on Monday. That comes from the layer underneath: the top stops on the constraint, the machines that caused them, and the fault codes behind those. Treating OEE as the end of the analysis is the most common misuse of it, and it’s why so many plants have a dashboard and no improvement.
For plants deciding where OEE fits in a broader data and systems roadmap, a digital maturity assessment for food and beverage plants is the wider frame.
Where should a food or beverage plant start with OEE?
Start with one line. Measure OEE at the constraint and at each machine around it, from the machines’ own PLCs where possible. Agree in writing what counts as planned time, sanitation and changeover included, before the first report goes out. Then review the top stops and their fault codes every week, and fix the biggest one.
A practical sequence:
- Pick one line. The one with the most output at stake, or the one everyone argues about.
- Inventory what each machine already knows. For every machine, list the controller, whether it’s on a network, and which states, fault codes and counts it exposes.
- Fix what blocks the data. Network connections, PLCs that can’t communicate, and fault words nobody mapped. This is usually the longest step and the most valuable.
- Write the definitions down. Planned time, sanitation, changeover, rated speed per product, and what counts as good. Get operations, maintenance and finance to agree.
- Report line and machine OEE together. Line OEE at the constraint for output, machine states and fault codes underneath for cause.
- Run a weekly top-stops review with maintenance in the room. Pick the biggest loss, fix it, and watch whether it comes back.
That approach isn’t theoretical. Before founding Joltek, Vladimir Romanov was engineering manager at a Kraft Heinz plant that made Lunchables. OEE there rose from about 40% to about 48%, a 20% improvement, through data systems, root cause analysis and operating discipline. None of it started with a new dashboard. It started with knowing which machines were losing the time, and why.
This is the work behind Joltek’s downtime and OEE improvement work: finding the losses worth fixing, fixing them, and making the gain stick, using data the plant can trust.
Frequently asked questions
How do you calculate OEE?
OEE is availability multiplied by performance multiplied by quality. Availability is run time divided by planned production time. Performance is ideal cycle time multiplied by total count, divided by run time. Quality is good count divided by total count. A filler that ran 87.5% of its planned time, at 83.3% of rated speed, with 98.1% good bottles, has an OEE of about 71.5%.
What is a good OEE for a food and beverage plant?
There is no reliable industry benchmark. The 85% figure comes from Seiichi Nakajima’s 1988 book on total productive maintenance, where it described ideal conditions. Published food and beverage averages come from vendor customer data, such as Evocon’s 53% for 2023 to 2024, and from self-reported surveys. The most useful comparison is a plant against its own trend, measured the same way every week.
Does CIP or sanitation count against OEE?
It depends on how the plant defines planned time, which is why it has to be decided once and written down. Under ISO 22400, setup counts against availability. Many food plants treat scheduled sanitation as planned downtime, which takes it out of the calculation entirely. Either choice can be defended. Changing it between reports, or between lines, makes the number meaningless.
Should OEE be measured per machine or per line?
Both. Line OEE, measured at the constraint, usually the filler on a bottling line, is the right number for output and capacity. It cannot say which machine caused the losses, because a filler blocked by a downstream machine stops the same way as a filler with its own fault. Machine-level states and fault codes are what show where the time actually went.
What is PackML, and does it help with OEE?
PackML is ISA-TR88.00.02, a standard state model and tag set for packaging and other machines. It gives every machine the same states, such as Execute, Held and Aborted, plus standard tags for stop reasons and product counts. That makes OEE data consistent across machines from different OEMs, but only if PackML is written into the machine purchase specification.
OEE is where the conversation starts
OEE in food and beverage manufacturing earns its place on the production office screen. It’s one number that tells a plant manager whether the plant is getting better or worse, and roughly how much capacity is sitting on the floor. But the number only becomes useful when it can answer the next question: which machine, which fault, and how often. That takes data from the machines themselves, a definition everyone agreed to before the first report, and the discipline to keep both honest.
If your plant has an OEE number that nobody trusts, or a line where everyone has a different explanation for the lost time, send Joltek the situation. The work starts with a focused review of what your machines already know and what it would take to get it out of them. Book a conversation.
Photo credits: header photo cropped from “Sierra Nevada Bottling” by Seth Taylor, CC BY-SA 4.0, via Wikimedia Commons. Conveyor photo cropped from “Krostitzer Brauerei - Abfuellung” by ChristianBier, CC BY-SA 3.0, via Wikimedia Commons.


References and further reading
- ISO 22400-2:2014, Automation systems and integration: Key performance indicators (KPIs) for manufacturing operations management, Part 2: Definitions and descriptions · ISODefines the OEE index and its time model. Amended in 2017; a second edition is in development.
- ISA-TR88.00.02-2022, Machine and Unit States: An Implementation Example of ISA-88 (PackML) · ISA
- OPC 30050: OPC UA for PackML · OPC Foundation
- OPC 40600: OPC UA for Weihenstephan Standards · OPC Foundation
- Introduction to TPM: Total Productive Maintenance · Seiichi Nakajima, Productivity Press, 1988The source of the 90, 95 and 99 percent 'ideal conditions' and of the six big losses. The link is a summary; the book itself is not online.
- Top Three Methods on How to Fudge Your OEE · Christoph Roser, AllAboutLean
- Sparkplug Specification, Version 3.0 (ISO/IEC 20237:2023) · Eclipse Foundation