
Solace Cloud: Managed Event Brokers, Deployment Models and Who Runs What
Solace Insights and Observability: Monitoring, Alerts and OpenTelemetry Tracing
Solace Insights explained: broker dashboards and monitors built on Datadog, OpenTelemetry distributed tracing across a mesh, and what to watch on a broker.
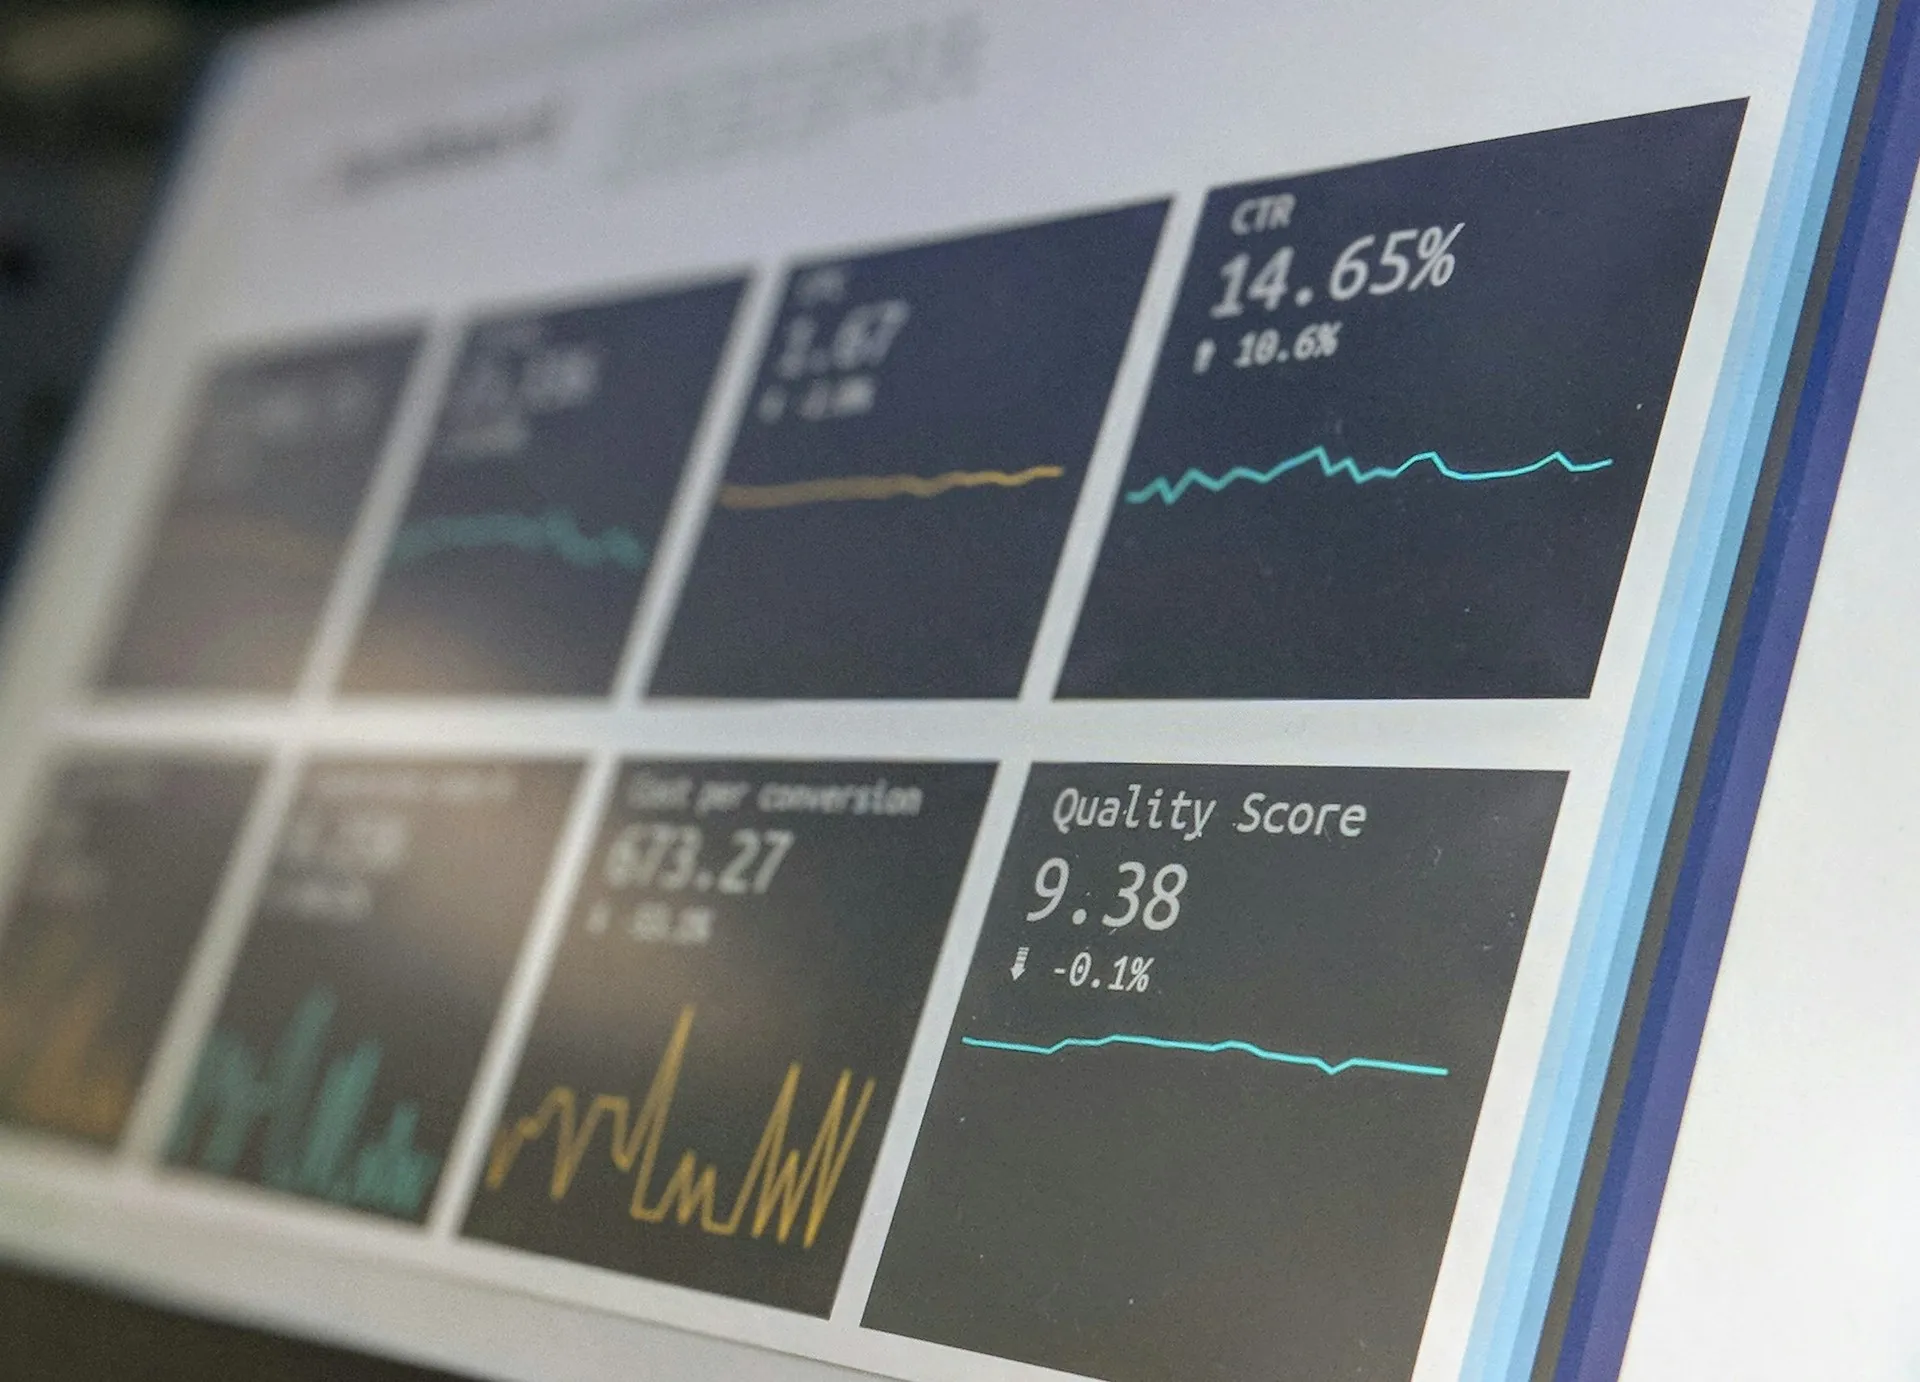
Solace Insights is Solace’s monitoring service for its event brokers: dashboards that show broker health, capacity and message flow, more than 50 pre-built monitors that raise alerts, and a route into distributed tracing with OpenTelemetry. It was called PubSub+ Insights until the May 2025 rename. Insights runs on Datadog behind the scenes, and in 2026 Solace extended it to every broker form factor with native export to Datadog, Dynatrace and New Relic.
This page explains what Insights shows, how broker tracing works, which signals deserve an alert in a plant context, and where observability gets hard. It sits under Solace Cloud in the Solace cluster.
What Solace Insights monitors
Solace’s Insights documentation describes a “centralized monitoring service” giving “at-a-glance status” on resource usage, event mesh health, message flow, high availability status and capacity.
| Layer | What you get | Who can see it |
|---|---|---|
| Account overview | One dashboard summarising the estate, traffic volume and alerts that need attention | All users with the account subscription |
| Service dashboards | Per-broker health in Cluster Manager | All users with access to the service |
| Advanced Monitoring | Solace-built dashboards in a Datadog account supplied with Insights, across all brokers | Users with an Insights Advanced role (manager, editor or viewer) |
| Monitors | More than 50 pre-created log, metric and status monitors, which you can clone and customise | Advanced Monitoring users |
| Notifications | Email alerts when thresholds are approached or exceeded, with alert, warning and information severities | Recipients set in the Cloud Console |
| Logs | Broker logs retained up to 30 days, 90 on request | Advanced Monitoring users |
Coverage, as documented in October 2026: Solace Cloud broker services, self-managed brokers on Docker, Podman and Kubernetes, and hardware appliances in Controlled Availability. On Solace’s pricing page, Insights, distributed tracing and “Insights third-party export” sit in the Scale package.
The Datadog account is separate. Solace states the Insights dashboards are reached “from a Datadog account provided with a Solace Insights subscription” that is “separate from any existing Datadog accounts”. If your company already runs Datadog, that means two places to look unless you use the third-party export.
Distributed tracing with OpenTelemetry
Metrics tell you a queue is growing. A trace tells you which message, from which publisher, waited where. Solace built tracing into the broker and aligned it with OpenTelemetry, the CNCF project that defines a common format for traces, metrics and logs. Solace’s engineers described the design on the CNCF blog.
How it works. When tracing is enabled, the broker generates spans at key points in a guaranteed message’s life, and writes them as special messages to a telemetry queue (tracing docs):
- a receive span when the broker receives or enqueues a message
- a send span when it delivers the message to a consumer or gets the acknowledgement
- a delete span when a message expires, exceeds its redelivery limit or its hop count
- a move span when a message goes to a dead message queue
A Solace receiver in the OpenTelemetry Collector’s contrib repository reads that queue and converts the spans to standard form for Jaeger, Datadog, Dynatrace and other backends. Its GitHub page lists it at beta stability for traces, connecting to the broker over AMQP with TLS. Applications add their own spans through Solace’s OpenTelemetry integration APIs, which inject and extract trace context so one trace ID follows the message. Release 10.26.0 added W3C trace context for AMQP clients (10.26.0 notes).
The limits are documented. Solace’s tracing docs say a product key is needed for production or long-term use (a demo mode allows short trials), that performance impact grows with message volume, that standby nodes do not generate spans in disaster recovery scenarios, and that transactional messages do not generate traces. A JMS application that publishes in transacted sessions will show gaps.
Why a plant should care. An illustrative scenario: a production order leaves ERP, crosses a cloud broker and a plant broker, and reaches MES four minutes late, so a line starts on the wrong recipe. Without tracing, three teams each prove their own system was fine. With context propagated end to end, the trace shows which hop held the message and for how long, and the conversation moves from blame to a fix.
What to watch on a Solace broker
Dashboards are only useful if someone knows which number matters. These are the signals we would put on an alert for a broker that carries plant data, whichever tool displays them. The thresholds depend on your design; the logic does not.

| Signal | What it usually means | Plant consequence if ignored |
|---|---|---|
| Queue depth rising steadily | A consumer is slow, stopped or disconnected | Spool fills, then publishers are refused and edge buffers start to overflow |
| Spool usage near quota | Capacity or retention is undersized for an outage | Messages are rejected during exactly the outage they were meant to survive |
| Connections near the service class limit | Device growth or a reconnect storm | New devices or HMIs cannot connect at the next shift change |
| Event mesh link down | WAN or broker problem between sites | Site data stops reaching ERP or analytics while the plant looks healthy locally |
| HA failover or standby lost | A node failed or is unreachable | The next failure is an outage rather than a switch-over |
| Discards and redeliveries | Malformed messages, consumers rejecting work | Silent data loss or duplicate orders downstream |
Decide who answers each alert. In many manufacturers, IT owns the broker and OT owns the systems publishing to it. An alert that goes to the wrong team at 3 a.m. is an alert nobody answers. Write the ownership into the runbook before the first one fires. The message replay page covers how to recover consumers that fell behind.
Exporting to your existing tools, and community options
Most enterprises already have an observability stack, and plants often have their own in SCADA. Solace’s May 2026 announcement covers native export to Datadog, Dynatrace and New Relic across “every single broker form factor”, and the 10.26.0 release notes list Datadog, Dynatrace and Splunk. Solace also lists Dynatrace and SL Corporation among its technology partners.
For teams on Prometheus and Grafana, a community Solace Prometheus exporter (MIT licence) exposes broker metrics. It is community-maintained, so treat it as a component you own. For the operations side of the console, see the sibling page on Solace Mission Control; for historians and plant monitoring, see SCADA and historians.
Where it gets hard
- Two Datadogs. The Insights Datadog account is separate from yours. Without export, operators juggle two consoles.
- Package and key cost. Insights and tracing are in the top Scale package, and tracing needs a product key in production. Neither price is public.
- Trace volume. Tracing every guaranteed message on a busy broker produces a large span stream and has a performance cost. Sample, or trace selected topics.
- Gaps by design. Transactional messages and standby DR nodes produce no spans. Know where your traces will go dark.
- Retention. Thirty days of logs (90 on request) is short for an audit trail. Forward anything you must keep.
- Appliances. Insights for appliances is in Controlled Availability as of October 2026.
Related: Solace Cloud overview · Solace Mission Control · Solace event broker HA and DR · Solace hub
Frequently asked questions
What is Solace Insights?
Solace Insights, formerly PubSub+ Insights, is Solace's monitoring service for event brokers. It provides account and service dashboards in the Solace Cloud Console and, with Advanced Monitoring, a set of Solace-built dashboards and more than 50 pre-created monitors in a Datadog account supplied with the subscription. It covers Solace Cloud services and, per Solace's docs, self-managed brokers.
Does Solace Insights require Datadog?
Insights uses Datadog as the third-party provider that collects and stores its metrics and logs, and its advanced dashboards are opened in a Datadog account that comes with the Insights subscription, separate from any Datadog account you already have. In 2026 Solace also announced native export of broker telemetry to Datadog, Dynatrace and New Relic for teams that want it in their own tools.
Does Solace support OpenTelemetry?
Yes. Solace event brokers can generate OpenTelemetry-compatible trace spans when they receive, send, move or delete guaranteed messages. A Solace receiver plugin for the OpenTelemetry Collector consumes those spans from a broker queue and forwards them to backends such as Jaeger or Datadog. Solace's messaging APIs can inject and extract trace context so one trace follows a message end to end.
Is Solace distributed tracing free?
Solace's documentation says a product key is required to use distributed tracing in production or for long-term use, with a demo mode for short trials. On Solace Cloud, distributed tracing and Insights are listed in the Scale package, the highest of the three published packages. Prices are not public, so ask for the cost of tracing separately in any quote.
Can I monitor Solace brokers with Prometheus and Grafana instead?
Yes, with community tooling. A Solace Prometheus exporter, published under the MIT licence in the SolaceCommunity GitHub organisation, exposes broker metrics for Prometheus to scrape. It is community-maintained rather than a supported product, so treat it as you would any open-source component: pin versions, test upgrades and decide who owns it.
References and further reading
- Solace Insights · Solace documentationStandard and advanced monitoring, coverage of self-managed brokers, log retention.
- Distributed tracing overview · Solace documentationSpan types, the OpenTelemetry receiver, licensing and limitations.
- Total platform observability: all form factors, all clouds, all APMs · Solace
- Solace receiver for the OpenTelemetry Collector · OpenTelemetry (GitHub)
- What is OpenTelemetry? · OpenTelemetry, a CNCF project
- Implementing OpenTelemetry natively in an event broker · CNCF